In This Tutorial, You Will Learn:
- How to install and configure Prometheus on a dedicated Linux server
- How to install and configure Grafana on a separate Linux server
- How to connect Grafana to Prometheus for data visualization
- How to import and create dashboards for monitoring your systems

Software Requirements and Linux Command Line Conventions
| Category | Requirements, Conventions, or Software Version Used |
|---|---|
| System | Any modern Linux distribution (Ubuntu, Debian recommended) |
| Software | Prometheus, Grafana (both installed from repositories) |
| Other | Root or sudo privileges on both servers, network connectivity between servers |
| Conventions | $ – Commands executed as a regular user with sudo privileges. |
Visual Monitoring Made Simple: Setting Up Prometheus and Grafana on Separate Linux Servers
ARCHITECTURE OVERVIEW
This tutorial sets up a distributed monitoring system with Prometheus on one server collecting metrics and Grafana on another server visualizing those metrics. Ensure both servers can communicate with each other over the network, with the required ports (9090 for Prometheus and 3000 for Grafana) properly configured in your firewall settings.
Prometheus serves as a powerful time-series database and monitoring system that pulls metrics from configured targets, while Grafana provides a beautiful and flexible visualization layer. By setting them up on separate servers, you can distribute the system load and create a more scalable architecture.
Step-by-Step Instructions
- Install Prometheus on Server 1: Use the package repository to install Prometheus
$ sudo apt update
$ sudo apt install prometheus
These commands update the package lists and install Prometheus from the official repositories. The package manager will handle all the dependencies (including Node Exporter), user creation, and initial configuration to get Prometheus up and running quickly. This approach is much simpler than manual installation and ensures future updates will be managed through the package system.
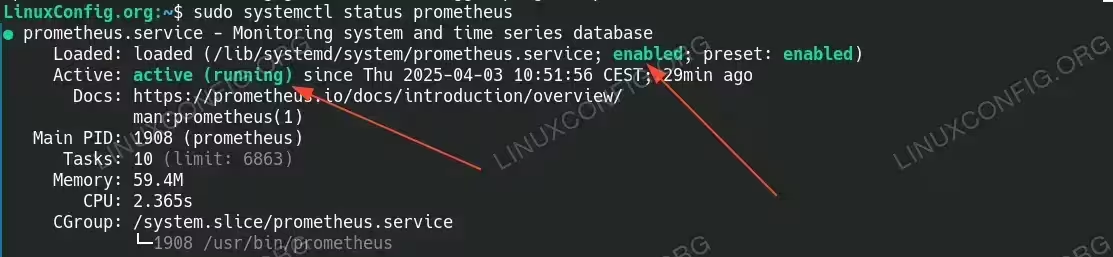
- Verify Prometheus Installation: Ensure the service is running properly
$ sudo systemctl status prometheus
$ sudo systemctl status prometheus-node-exporter
These commands check if Prometheus and Node Exporter (which was automatically installed as a dependency) are running correctly. You should see output indicating that both services are active and running. If either service is not running, you can start it with
sudo systemctl start [service-name].
Verify Prometheus Installation - Configure Prometheus: Adjust the default configuration
$ sudo nano /etc/prometheus/prometheus.yml
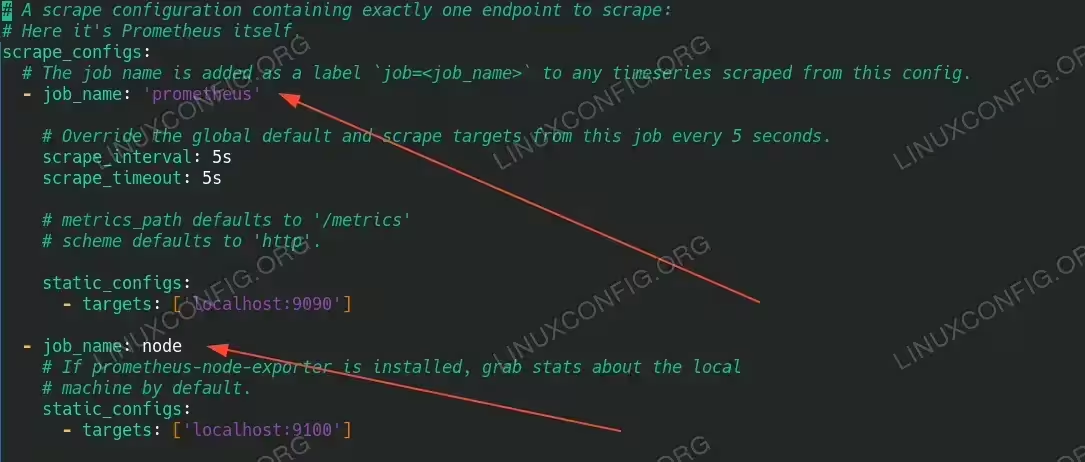
The default configuration file is already set up to monitor Prometheus itself and should already include Node Exporter as a target since they were installed together. Verify that your configuration includes both targets:
global:
  scrape_interval: 15s

scrape_configs:
  - job_name: 'prometheus'
    static_configs:
      - targets: ['localhost:9090']

  - job_name: 'node'
    static_configs:
      - targets: ['localhost:9100']
If the Node Exporter configuration is not already included, add it as shown above.

Node Exporter and Prometheus configuration Then restart Prometheus to apply any changes:
$ sudo systemctl restart prometheus
- Configure Firewall for Prometheus: Allow external connections to Prometheus
$ sudo ufw allow 9090/tcp
This command opens port 9090 in the firewall, allowing Grafana on the other server to connect to Prometheus. If you’re using a different firewall solution, adjust the command accordingly.
- Install Grafana on Server 2: Add Grafana’s repository and install the package
$ sudo apt install -y apt-transport-https software-properties-common wget
$ wget -q -O - https://packages.grafana.com/gpg.key | sudo apt-key add -
$ echo "deb https://packages.grafana.com/oss/deb stable main" | sudo tee -a /etc/apt/sources.list.d/grafana.list
$ sudo apt update
$ sudo apt install -y grafana
Since Grafana isn’t available in the standard repositories, we need to add their official repository first. These commands install the necessary dependencies, add the Grafana repository, and then install Grafana from that repository.
- Start and Enable Grafana: Activate the Grafana service
$ sudo systemctl enable --now grafana-server
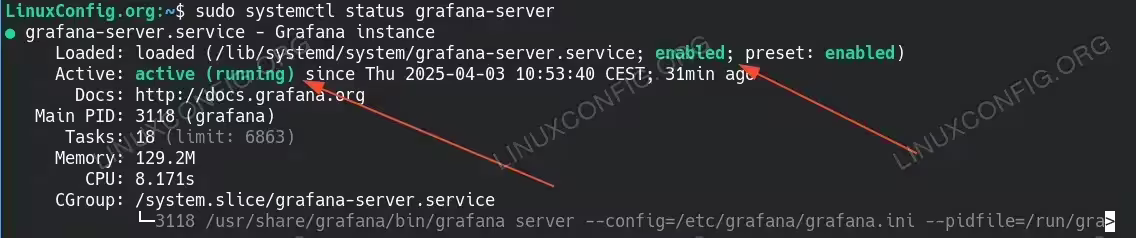
This command both enables Grafana to start automatically on boot and starts the service immediately. Verify Grafana is running with
sudo systemctl status grafana-server.
Verify that Grafana is running - Configure Firewall for Grafana: Allow external connections to Grafana
$ sudo ufw allow 3000/tcp
This command opens port 3000 in the firewall, allowing users to access the Grafana web interface. Grafana’s default port is 3000, but this can be changed in the configuration file if needed.
- Connect Grafana to Prometheus: Log in to Grafana and add Prometheus as a data source
Access Grafana in your web browser athttp://[grafana-server-ip]:3000. Log in with the default credentials (username: admin, password: admin) and follow these steps:-
- Click on “Connections” in the left sidebar menu
- Click on “Add new connection” or “Data sources”
- Select “Prometheus”
- Set the URL to
http://[prometheus-server-ip]:9090(replace with your actual Prometheus server IP) - Click “Save & Test” to verify the connection

Added Prometheus as a data source. Change IP or host to point to your Prometheus server -
- Import Existing Dashboards: Leverage community-created dashboards
Grafana has a rich library of pre-built dashboards that you can easily import:- Click “Dashboards” in the left sidebar
- Click the “New” button in the top-right corner
- Select “Import” from the dropdown menu
- Enter dashboard ID 1860 (a popular Node Exporter dashboard named “Node Exporter Full”)
- Select your Prometheus data source from the dropdown menu
- Click “Import”
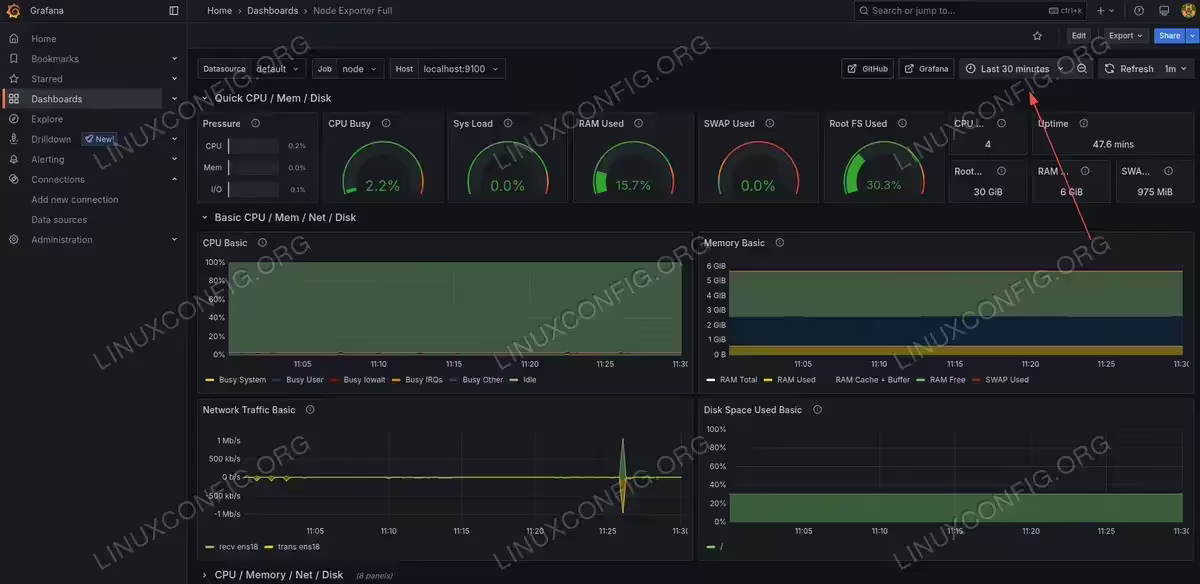
This will import a comprehensive system monitoring dashboard specifically designed for Node Exporter metrics. You’ll immediately see metrics such as CPU usage, memory usage, disk I/O, and network traffic without having to configure individual panels, similar to the screenshot shown in the tutorial.

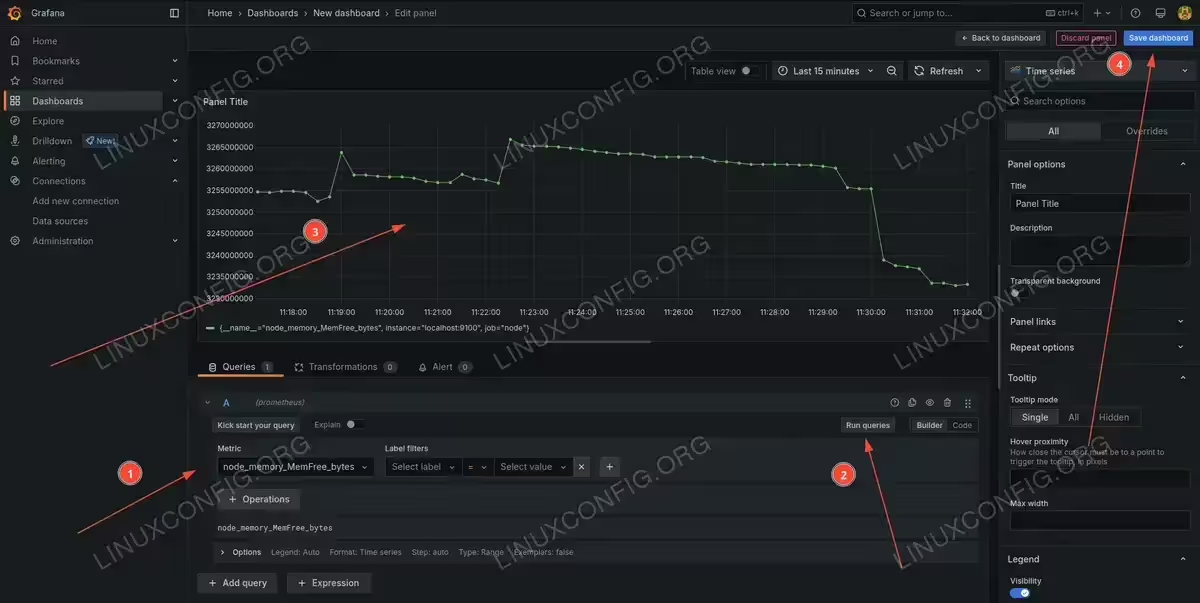
Imported dashboard template - Create Your Own Dashboard (Optional): Build a custom dashboard tailored to your needs
To create a custom dashboard that focuses on specific metrics you care about:- Click “Dashboards” in the left sidebar
- Click the “New” button in the top-right corner
- Select “New dashboard” from the dropdown menu
- Click “Add visualization”
- In the data source section, select “prometheus” from the dropdown
- Under “Metric”, select a metric such as
node_memory_MemFree_bytesfrom the dropdown - Click “Run queries” to preview the data
- Adjust the visualization settings as needed in the right panel
- Add a title for your panel in the “Panel options” section on the right
- Click “Apply” to add the panel to your dashboard
- Repeat the process to add additional panels for other metrics
- Click “Save dashboard” in the upper right corner to save your dashboard with an appropriate name
Creating your own dashboards lets you focus on the specific metrics that matter most to your infrastructure and arrange them in a way that makes the most sense for your monitoring needs.

Creating Custom Grafana dashboard with custom monitoring query.

BUNDLED EXPORTERS
When installing Prometheus via apt on Debian/Ubuntu systems, Node Exporter is automatically installed as a dependency. This gives you system metrics monitoring out of the box without additional steps. You can verify this by checking sudo systemctl status prometheus-node-exporter. The package manager handles all the configuration needed to integrate these components smoothly.
Conclusion
You’ve successfully set up a distributed monitoring system with Prometheus collecting metrics on one server and Grafana visualizing them on another. This setup provides a foundation for comprehensive monitoring of your infrastructure. The package-based installation approach makes the process straightforward while still giving you the flexibility to configure the system according to your needs. With Node Exporter automatically installed alongside Prometheus, you immediately have access to detailed system metrics without additional configuration. You can extend this system by adding more exporters to monitor various services, creating alerts for critical conditions, and designing custom dashboards for different aspects of your environment.
Frequently Asked Questions (FAQ)
-
How can I monitor additional servers with this setup?
To monitor additional servers, install Node Exporter on each server you want to monitor using
sudo apt install prometheus-node-exporter. Then update your Prometheus configuration by adding each server as a target in thenode_exporterjob. For example:- job_name: 'node_exporter' static_configs: - targets: ['localhost:9100', 'server2:9100', 'server3:9100']Remember to replace ‘server2’ and ‘server3’ with the actual hostnames or IP addresses, and ensure the firewall on each server allows connections to port 9100.
-
How do I set up alerts in Prometheus and Grafana?
For Prometheus alerts, you need to install Alertmanager with
sudo apt install prometheus-alertmanager, define alert rules in/etc/prometheus/rules.yml, and reference it in your Prometheus configuration. For Grafana alerts, navigate to the dashboard panel you want to create an alert for, click on the panel title, select “Edit,” and then click on the “Alert” tab. From there, you can define conditions for the alert and specify notification channels like email, Slack, or PagerDuty. -
How do I update Prometheus and Grafana when new versions are released?
Since you’ve installed Prometheus from the standard repositories, simply run
sudo apt updatefollowed bysudo apt upgradeto update Prometheus and other system packages. For Grafana, which was installed from its own repository, the same commands will work as long as the Grafana repository remains in your sources list. Both services will automatically restart after updates if needed. Always check the release notes for major version updates as they might require configuration changes. -
What are some useful dashboard IDs I can import in Grafana?
Here are some popular dashboards for monitoring systems with Prometheus and Node Exporter:
- ID 1860: Node Exporter Full – Comprehensive system metrics
- ID 11074: Node Exporter for Prometheus – Modern dashboard with clean design
- ID 3662: Prometheus 2.0 Overview – For monitoring Prometheus itself
- ID 9578: Node Exporter Server Metrics – Focused on key server health indicators
- ID 9096: Prometheus Stats – Detailed Prometheus monitoring
To import any of these dashboards, go to the “+” icon in Grafana, select “Import,” enter the dashboard ID, select your Prometheus data source, and click “Import”.
-
How do I secure my Prometheus and Grafana instances?
To secure Prometheus, consider setting up a reverse proxy with basic authentication (using Nginx or Apache), implementing TLS encryption, and configuring strict firewall rules to limit access. For Grafana, change the default admin password immediately, set up proper user authentication (LDAP, OAuth, etc.), enable HTTPS by configuring the settings in
/etc/grafana/grafana.ini, and consider using Grafana’s built-in user roles to restrict access to dashboards and data sources. Additionally, regularly update both Prometheus and Grafana through your package manager to patch security vulnerabilities. -
How can I monitor specific applications beyond system metrics?
To monitor specific applications, you’ll need to install additional Prometheus exporters. Many common applications have dedicated exporters available in the repositories. For example:
- MySQL/MariaDB:
sudo apt install prometheus-mysqld-exporter - PostgreSQL:
sudo apt install prometheus-postgres-exporter - Nginx:
sudo apt install prometheus-nginx-exporter - Apache:
sudo apt install libapache2-mod-prometheus
After installing the appropriate exporter, add it as a target in your Prometheus configuration and restart Prometheus. Then import or create dashboards in Grafana that use the metrics from these exporters.
- MySQL/MariaDB: