
Mathematics with Cinderella: Various Curves: Conic Section Drawing Device Using a Crossed Parallelogram

Photographs and explanatory diagrams of the drawing device
This is a drawing device for ellipses and hyperbolas using a crossed parallelogram, as featured in "Encyclopedia of Curves" (edited by Masami Isoda et al., Kyoritsu Shuppan, 2009).
Given a crossed parallelogram ABCD where AD = BC and AB = CD, with side AB fixed on a plane, point D rotates around point A, and point C rotates around point B. When point D rotates around point A, point C rotates around point B, and the intersection point P of lines AD and BC traces an ellipse or a hyperbola.
When sides AD and BC intersect, it draws an ellipse; when sides AB and CD intersect, it draws a hyperbola. The following are photographs and diagrams of each drawing device.
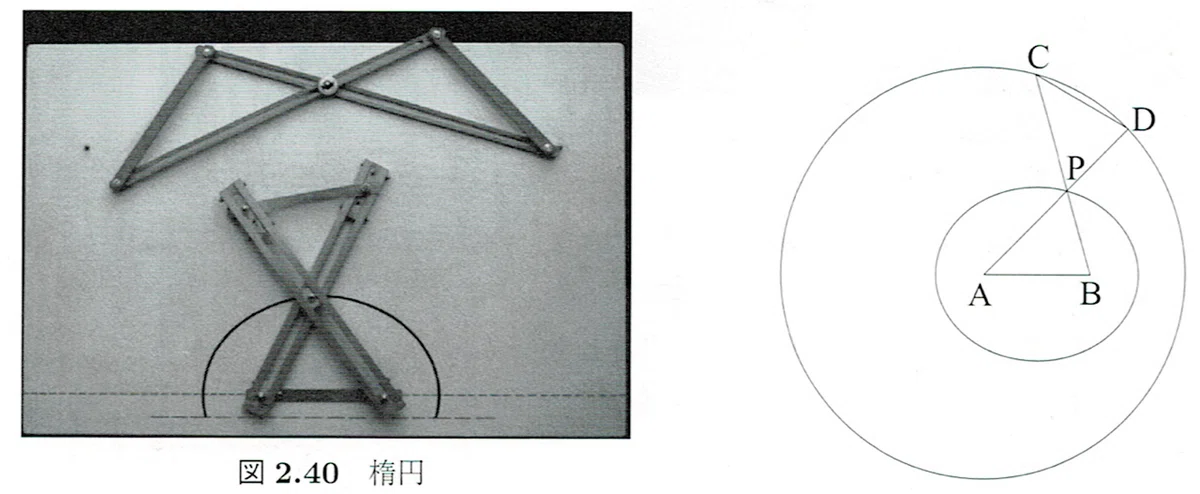

There are two crossed parallelograms in the photograph of the ellipse drawing device, but the top one is not involved in drawing the ellipse. Also, the orientation of the hyperbola drawing device and its diagram are reversed.
Drawing with Cinderella
Drawing with Cinderella is simple, but it requires a little ingenuity. Since AB is fixed, first draw a line segment AB of an appropriate length. Next, for C and D, since AD = BC, draw circles centered at A and B using the tool for drawing circles with a fixed radius. You must place C and D on the circumferences of these circles, but since D is a moving point, you must place it first. Therefore, the order of construction for C and D is reversed. Next, for AB = CD, use the compass tool to take the length of AB and draw a circle centered at C. Now that you can draw the crossed parallelogram, find the intersection point and display its locus.

Next, construct it so that side AB and side CD intersect. This time, C and D are reversed again.
After taking line segment AB, a circle centered at A, and a point C on the circle, use the compass tool to draw a circle centered at B with a radius equal to AC, and a circle centered at C with a radius equal to AB. The intersection of these two circles is D. Draw lines AC and BD, find their intersection, and display the locus.

Let's look at the photographs of the drawing devices on the web.
If you go to "Conic Sections" from the table of contents on the left, you will find "Conic Sections Using Crossed Quadrilaterals." It is in color, and you can click on the photos to enlarge them. The following is what I made by imitating the drawing device while looking at these photos. In the actual drawing device, the range of motion of the linkage is narrow, so only a part of the hyperbola can be drawn.
Imitating the drawing device
To create an imitation based on the Cinderella construction while looking at the photos of the drawing device, use CindyScript.
The following diagram shows line segment AB drawn with Cinderella's drawing tools and the bars made from it. AB was drawn with the line segment tool, CD had its line color and thickness changed using the inspector, and EF and GH were drawn with CindyScript. In all cases, the point sizes have been reduced, and the labels for the line segments have been hidden.

Can you see that the ends of CD are rounded, while the ends of the bars EF and GH are square? Furthermore, the amount of protrusion from the ends differs between GH and EF. In GH, the original line segment is hidden. In addition to changing the thickness with the inspector as in CD, you can also change the length of the protrusion, so the difference when using CindyScript is the shape of the ends and the color. Colors in the inspector are chosen from a color sample, but you can create other colors using CindyScript.
The script is as follows. Write this function in the Initialization slot and use it in the Draw slot.
bar(p1, p2, ln, th, col, alp):=(
  nv = complex((p2 - p1)/|p2 - p1|)*ln;
  z1 = complex(p1);
  z2 = complex(p2);
  z3 = z1 + nv*(cos(pi - th) + i*sin(pi - th));
  z4 = z1 + nv*(cos(th - pi) + i*sin(th - pi));
  z5 = z2 + nv*(cos(-th) + i*sin(-th));
  z6 = z2 + nv*(cos(th) + i*sin(th));
  p3 = gauss(z3);
  p4 = gauss(z4);
  p5 = gauss(z5);
  p6 = gauss(z6);
  fillpoly([p3,p4,p5,p6], color -> col, alpha -> alp);
);
The contents of the function are explained in the following diagram.

nv is a vector of length len in the direction of $${\overrightarrow{\rm{AB}}}$$. It is expressed as a complex number. If you tilt nv by th, you get a diagonal vector, so extend it in four directions from points A and B respectively. These are p3, p4, p5, and p6. Paint the rectangle with these four points as vertices in color col. alp is the transparency. You can adjust the size and hue by changing the arguments.
Also, if you change fillpoly to drawpoly, it becomes a rectangle that is not filled. For example,
drawpoly([p3,p4,p5,p6], color -> col, alpha -> alp, size -> 4);Let's call this bar2(p1, p2, ln, th, col, alp).
The following diagram shows the necessary points added based on the hyperbola construction.

If you write this in the Draw slot,
bar2(C, F, 0.2, pi/4, [0.9,0.8,0], 1);the CF will look like this.

In this way, you can create bars by changing the color and transparency, and hide auxiliary lines such as circles to complete it.
←Return to the list of articles on Mathematics and Information with Cinderella