Introduction
In the world of financial technology, systems process millions of transactions every minute. Even one payment failure or security breach can lead to major financial losses and quickly damage customer trust. Traditional monitoring – watching a few dashboards and reacting to alerts – is no longer enough.
Observability-Driven Development (ODD) takes a different approach. Instead of asking “Is the system up?”, it asks “Why did the system behave this way?”. Embedding observability directly into the development process helps fintech teams understand and improve their systems in real time. Instead of just collecting logs and metrics, teams can turn this data into useful insights that help detect problems, debug issues, and optimize performance quickly.
This article explains what observability means in a fintech environment, how to build a practical observability pipeline, and how to turn raw system data into meaningful actions.
What is Observability?
Observability means being able to understand what is happening inside a system by looking at the data it produces. It is usually built on three main components:
Logs – Time-stamped records of events. In fintech systems, logs track things like transaction attempts, login activity, and API calls.
Metrics – Numeric measurements over time, such as transaction volume, error rates, and response latency (for example p99 latency).
Traces – The full path of a request as it moves through multiple microservices, showing where time is spent and where failures occur.
Together, these signals help engineers see not only that something went wrong, but also where it happened, why it happened, and how to fix it quickly.
The Five-Step Observability Pipeline
The diagram below illustrates how raw data flows from production systems to actionable intelligence:
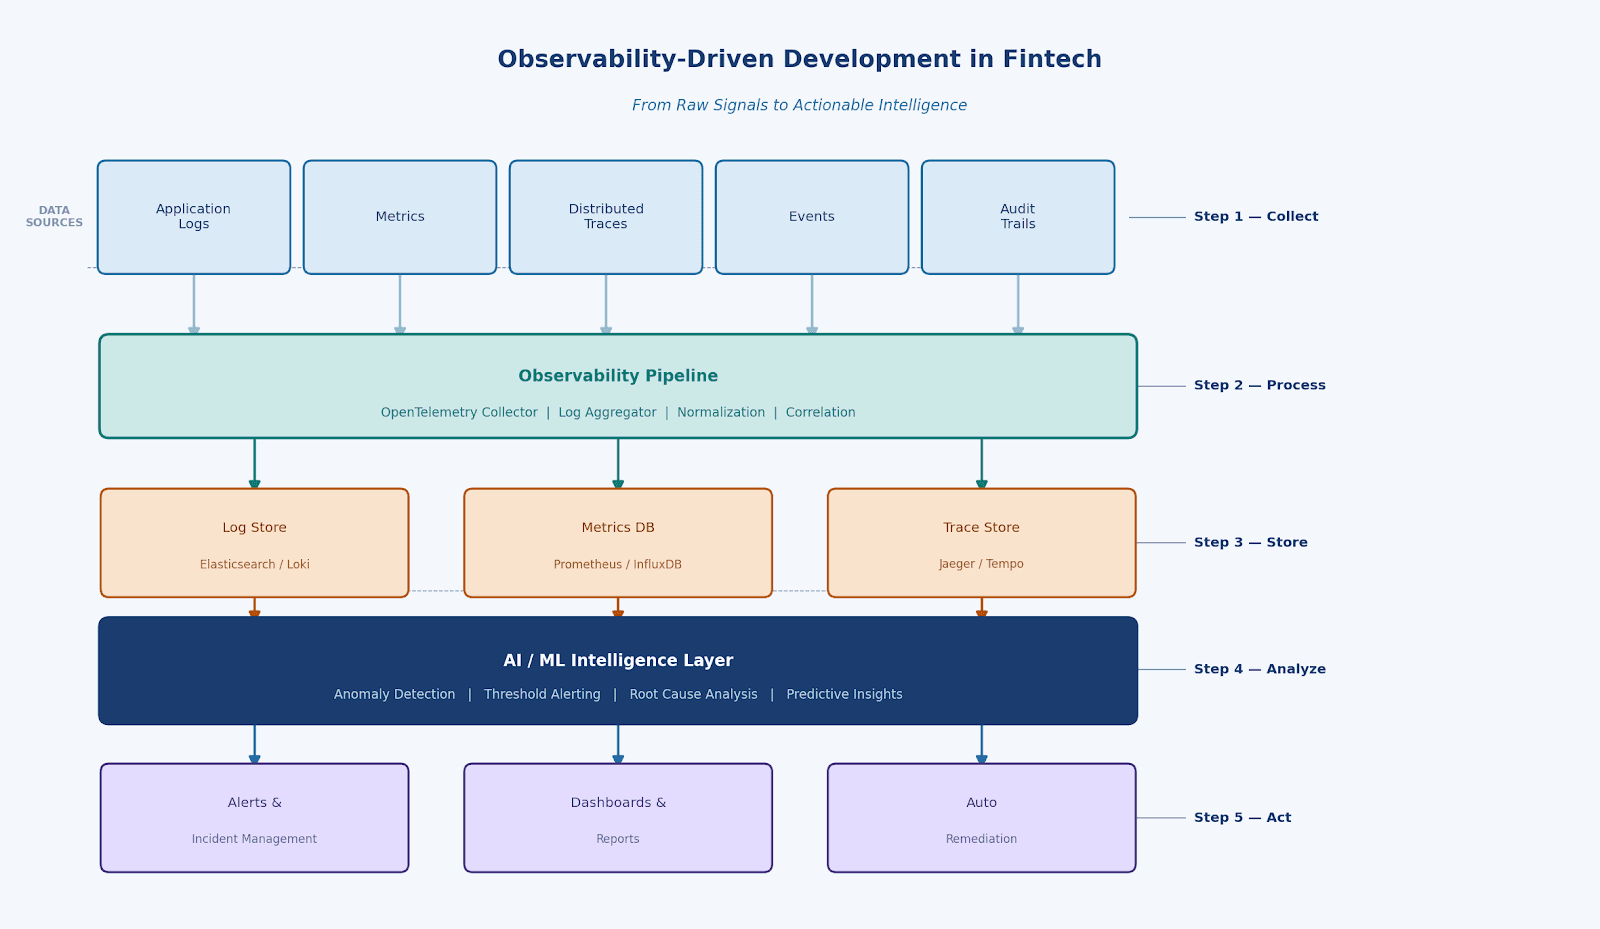
Step 1 – Collect: Instrument Everything
Observability starts at the source. Payment services, authentication APIs, and fraud detection systems all generate operational data.
The key is to collect this data in a consistent way. Tools like OpenTelemetry help standardize how logs, metrics, and traces are generated across all services, making it easier to monitor and understand the entire system.
A minimal Java instrumentation example using the OpenTelemetry SDK:
Tracer tracer = openTelemetry.getTracer("payment-service");
Span span = tracer.spanBuilder("processPayment").startSpan();
span.setAttribute("transaction.id", txnId);
span.setAttribute("amount", amount);
// ... business logic
span.end();
Step 2 – Process: Normalize and Correlate
Raw data from many services often arrives in different formats. The OpenTelemetry Collector acts as a central pipeline that receives this data, converts it into a common format, adds useful context (such as region, environment, or service version), and sends it to the right storage system.
An important part of this process is correlation. Here is an example, a slow request trace, a spike in error metrics, and a related log message might all come from the same problem. By linking them with a shared trace ID, the system helps engineers quickly see the complete picture and identify the root cause.
Step 3 – Store: The Right Backend for Each Signal
Different types of observability data need different storage systems:
Logs: Stored in tools like Elasticsearch or Loki, which are designed to quickly search large amounts of log data.
Metrics: Stored in Prometheus or InfluxDB, which are designed for time-series numeric data such as throughput, latency, and error rates.
Traces: Stored in Jaeger or Tempo, which help reconstruct how a request travels across multiple services.
In PCI-DSS regulated environments, storage must also follow strict rules. For example, transaction logs are usually kept for about 12 months, and sensitive information like card numbers must be masked or tokenized before being stored.
Step 4 – Analyze: From Data to Intelligence
This is where observability starts to provide real value. Simple rules related to failure more that 1% can find the obvious problem. But in other hand it can miss the smaller and slower Issues.
An intelligence layer uses machine learning and analytics to detect unusual patterns, warn about potential failures early, and help engineers to find the root cause quickly.
A Prometheus alerting rule for payment failure rate:
groups:
  - name: payment-slos
    rules:
    - alert: HighPaymentFailureRate
      expr: rate(payment_errors_total[5m]) > 0.01
      for: 2m
      annotations:
        summary: "Payment failure rate exceeds SLO threshold"
Step 5 – Act: Close the Loop
Intelligence is valuable only when it leads to action. Modern fintech platforms use observability insights in several ways.
Alerting and Incident Management: Tools like PagerDuty or OpsGenie send alerts to the correct on-call engineer, along with useful context such as the trace ID, affected service, and recent deployments.
Dashboards & Reports: Grafana dashboards give teams a live view of transaction health, SLO burn rates, and infrastructure cost. Executive reports are generated automatically from the same data.
Auto-Remediation: Runbook automation can restart a pod, roll back a deployment, or scale a service – all triggered by observability signals without human intervention.
Fintech-Specific Considerations
Using observability in fintech systems comes with challenges that are not common in typical software environments.
PCI-DSS Compliance: Logs should never store raw card details like PAN or CVV. Sensitive data should be masked or tokenized at the source before it enters the observability pipeline.
High-Volume Systems: Payment platforms can process tens of thousands of transactions per second. To control storage costs, systems often use sampling, such as collecting 10% of traces during normal operation and increasing to 100% during incidents.
Audit Requirements: For regulatory audits, financial systems must keep secure, timestamped records of all transactions. Observability systems must support storing the logs which cannot be editable.
Low Latency Requirements: Payment processing speed should not be impacted by Observability. Tools which use (OpenTelemetry) asynchronous data export and batching to collect telemetry without adding noticeable latency.
Real-World Impact
Teams that adopt observability-driven development often see clear improvements. Incident resolution time (MTTR) decreases because engineers already have the necessary context and don’t need to spend time reproducing the issue first. Early anomaly detection also helps teams identify system slowdowns or errors before customers are affected. Over time, observability data also improves the development process. Teams can find slow database queries, inefficient API calls, or unstable code paths and fix them before they turn into real incidents.
In large-scale payment infrastructure, this shift from reactive monitoring to proactive intelligence is not just operationally valuable – it becomes a competitive differentiator and a compliance enabler.
Conclusion
A practical approach is the five-step pipeline:
Collect –> Process –> Store –> Analyze –> Act.
Teams can easily adopt this step by step. It can be satrted by adding consistent instrumentation using OpenTelemetry, then build a central pipeline to collect the data. Create dashboards that show not only what happened, but also why it happened. Finally, use these insights to automatically respond to issues and improve the system.
In fintech systems, where every millisecond and transaction matters, observability is not optional. It is a key part of building reliable and trustworthy financial software.
