Java applications run on the Java Virtual Machine (JVM), which manages memory in two primary segments: heap and non-heap. While heap memory often gets more attention due to its role in object allocation and garbage collection, non-heap memory is equally crucial for performance and stability. In this article, we will explore what non-heap memory is and how to monitor it using several tools effectively.
1. Understanding Non-Heap Memory in JVM
Before we can effectively monitor non-heap memory, it is important to understand what it encompasses. Non-heap memory refers to native memory areas managed by the JVM that exist outside the Java heap. These areas are crucial for internal JVM operations such as storing class metadata, compiled bytecode, and managing thread stacks. Unlike heap memory, which is primarily used for object allocation, non-heap memory supports the structural and execution aspects of a Java application.
1.1 Why Monitor Non-Heap Memory?
Monitoring non-heap memory is essential because:
- A Metaspace OutOfMemoryError can crash your app.
- Growing code cache may degrade performance.
- Thread and buffer allocation can lead to native memory leaks.
2. Sample Application
To observe non-heap memory usage in action, let’s create a simple Java application that deliberately triggers activity in non-heap regions like Metaspace and the thread stack. This is done by dynamically loading custom class loaders and spawning multiple threads. The application will then remain active for a few minutes, giving us time to attach monitoring tools and analyze how non-heap memory is utilized during runtime.
public class NonheapMonitorApp {

    public static void main(String[] args) throws InterruptedException {
        List<ClassLoader> classLoaders = new ArrayList<>();

        // Simulate class loading
        for (int i = 0; i < 1000; i++) {
            classLoaders.add(new CustomClassLoader());
            if (i % 100 == 0) {
                System.out.println("Loaded " + (i + 1) + " custom class loaders.");
            }
        }

        // Simulate thread creation
        for (int i = 0; i < 100; i++) {
            Thread t = new Thread(() -> {
                try {
                    Thread.sleep(60000); // Keep thread alive for observation
                } catch (InterruptedException e) {
                    Thread.currentThread().interrupt();
                }
            });
            t.start();
        }

        // Keep application running to allow inspection
        Thread.sleep(5 * 60 * 1000);
    }

    static class CustomClassLoader extends ClassLoader {
        // Simple custom class loader
    }
}
3. Tools for Monitoring Non-Heap Memory
3.1 Monitoring JVM Non-Heap Memory Using VisualVM
VisualVM is a tool the Java community provides for profiling and monitoring JVM-based applications. It offers insights into both heap and non-heap memory usage, including areas like Metaspace, Code Cache, and Thread Stacks. To monitor non-heap memory areas like Metaspace and loaded classes, we will need to add the VisualVM MBeans browser plugin, which gives us deeper access to JVM internals exposed through Java Management Extensions (JMX).
Installing the MBeans Plugin in VisualVM
To begin monitoring non-heap memory usage:
- Launch VisualVM.
- In the menu bar, navigate to
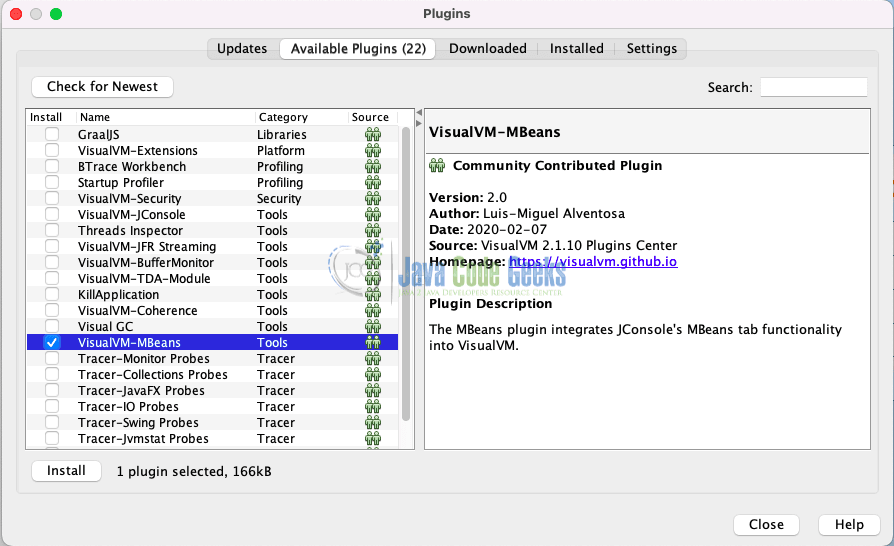
Tools > Plugin - Switch to the Available Plugins tab.
- Search for “MBeans” or “VisualVM-MBeans”.
- Select the plugin and click Install.
- Follow the wizard to complete the installation.
Once VisualVM is successfully attached to your running Java application, navigate to the Monitor tab to begin observing various real-time performance metrics. This section provides a comprehensive overview of the application’s internal behavior, including CPU usage, the number of live threads, heap memory consumption, and importantly, Metaspace usage, which falls under the category of non-heap memory. Additionally, we can track the number of loaded classes and monitor garbage collection (GC) activity.
Below is a screenshot showing the Metaspace Usage panel in VisualVM, which reflects how much non-heap memory is currently allocated for class metadata.

Using the MBeans Tab for Deeper Insight
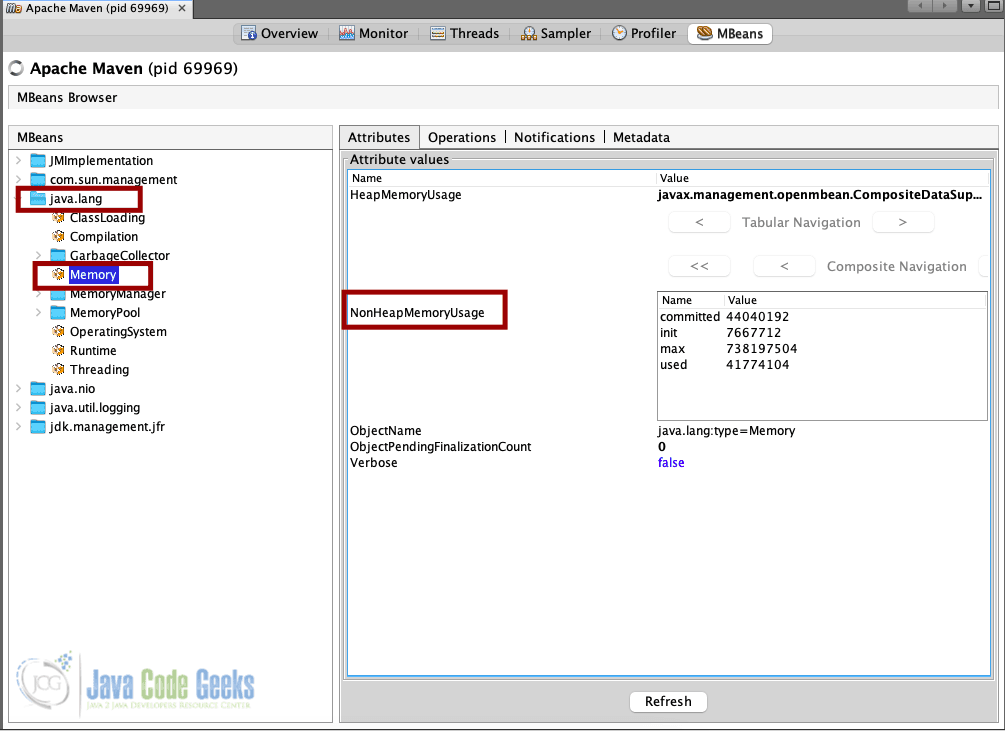
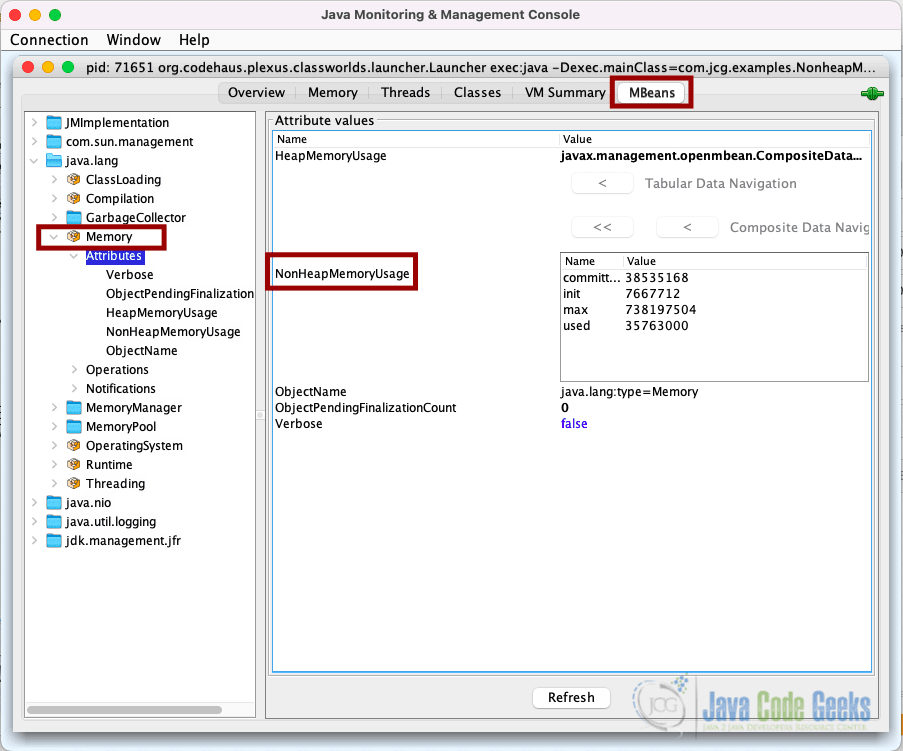
We can use the MBeans tab in VisualVM to gain deeper insights into various non-heap memory sections beyond what is shown in the Monitor tab. By navigating through the MBeans interface, particularly under the java.lang domain, we can explore detailed attributes such as NonHeapMemoryUsage, which provides both current and peak usage statistics. Browse the tree structure:
java.lang > Memory: Shows detailed stats forNonHeapMemoryUsage.
3.2 Monitoring Non-Heap Memory with JConsole
JConsole is a built-in GUI tool for monitoring Java applications via JMX. It provides easy-to-read charts for heap and non-heap memory, CPU, threads, and class loading.
Step 1: Launch JConsole
To launch JConsole, you can either open a terminal and simply type:
jconsole
Alternatively, you can navigate to your JDK’s bin directory and run the executable directly from there. This utility is included with the JDK and provides a graphical interface for monitoring and managing Java applications through Java Management Extensions (JMX).
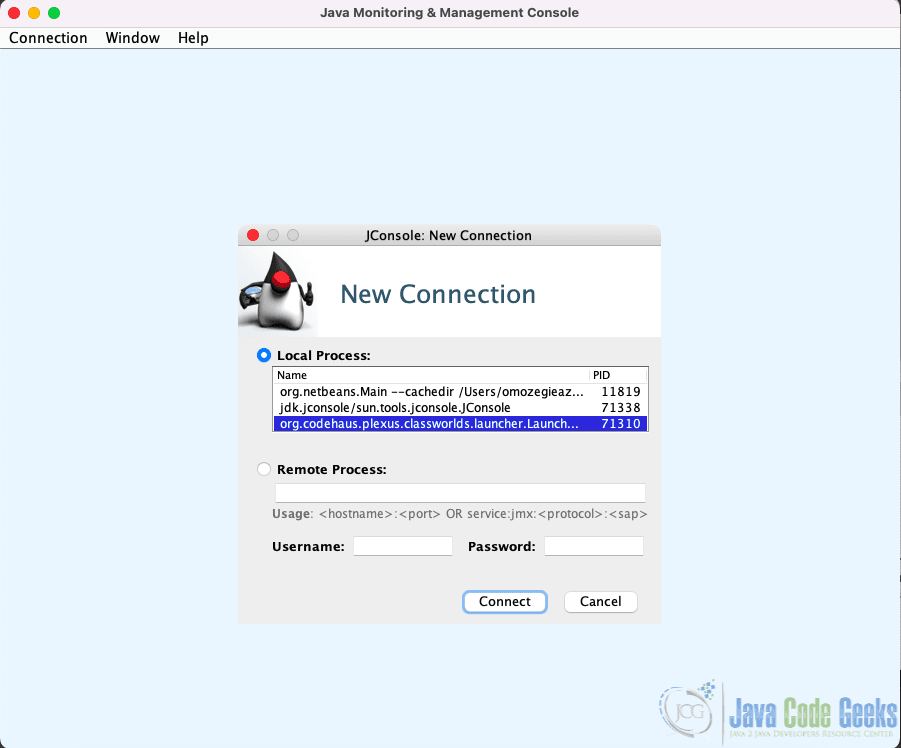
Step 2: Connect to Local or Remote Process
- Select your Java process from the list.
- Click Connect.
If you are connecting remotely (e.g., to a process started with -Dcom.sun.management.jmxremote options), provide the hostname and port.
Step 3: Monitor Non-Heap Memory and Metaspace
Once connected:
- Go to the Memory tab.
- In the Chart dropdown, select:
- Non-Heap Memory Usage
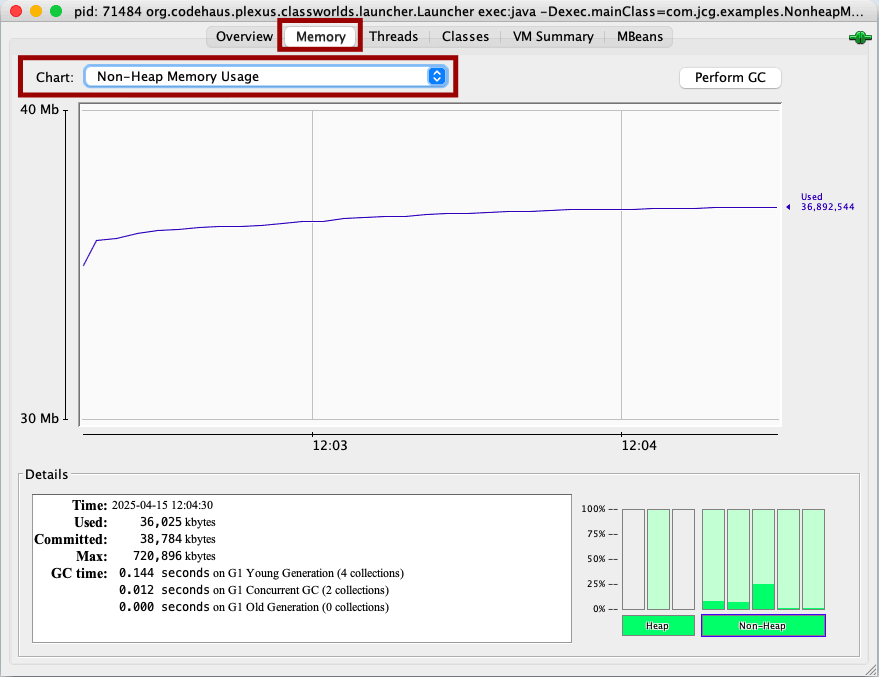
This lets you visualize how the non-heap memory region grows and shrinks over time.
Explore Other Tabs
JConsole offers several other informative tabs that provide insights into various aspects of our application’s runtime behavior. These include detailed views of thread activity, class loading statistics, and access to MBeans for monitoring and managing specific JVM components.
- MBeans Tab: Just like VisualVM, navigate to:
java.lang > Memory >ViewNonHeapMemoryUsage
3.3 Monitoring Non-Heap Memory with jcmd
The jcmd tool is a command-line utility bundled with the JDK. It allows us to inspect and diagnose memory usage, garbage collection, class loading, and other runtime metrics, making it ideal for accessing non-heap memory statistics such as Metaspace and Code Cache.
To effectively monitor non-heap memory using jcmd, it’s essential to enable Native Memory Tracking (NMT), which provides detailed statistics about native memory usage within the JVM, including non-heap areas like Metaspace, Code Cache, and thread-related allocations.
To enable NMT, you need to start your Java application with the following JVM option:
java -XX:NativeMemoryTracking=summary -jar target/nonheap-monitor-app-1.0.jar
This enables summary-level native memory tracking, which is sufficient for most monitoring scenarios. If you need more fine-grained detail, you can use detail instead of summary:
java -XX:NativeMemoryTracking=detail -jar target/nonheap-monitor-app-1.0.jar
Once your application is running, you can use the jcmd command to retrieve memory details. First, identify the process ID of your running application:
jcmd
List Java Processes – Output:
72229 target/nonheap-monitor-app-1.0.jar
72233 jdk.jcmd/sun.tools.jcmd.JCmd
Then use the following command to print native memory statistics:
jcmd 72229 VM.native_memory
This will output memory usage categorized into different sections like Metaspace, Thread, Code, and GC, providing a clear view of how non-heap memory is being utilized by the JVM.
Native Memory Tracking:

(Omitting categories weighting less than 1KB)

Total: reserved=3579078KB, committed=219442KB
       malloc: 11266KB #11807
       mmap:   reserved=3567812KB, committed=208176KB

-                 Java Heap (reserved=2097152KB, committed=133120KB)
                            (mmap: reserved=2097152KB, committed=133120KB)

-                     Class (reserved=1048672KB, committed=224KB)
                            (classes #791)
                            (  instance classes #676, array classes #115)
                            (malloc=96KB #1733) (peak=122KB #1931)
                            (mmap: reserved=1048576KB, committed=128KB)
                            (  Metadata:   )
                            (    reserved=65536KB, committed=320KB)
                            (    used=233KB)
                            (    waste=87KB =27.15%)
                            (  Class space:)
                            (    reserved=1048576KB, committed=128KB)
                            (    used=15KB)
                            (    waste=113KB =87.94%)

-                    Thread (reserved=18482KB, committed=18482KB)
                            (thread #18)
                            (stack: reserved=18432KB, committed=18432KB)
                            (malloc=31KB #112) (peak=240KB #716)
                            (arena=19KB #34) (peak=135KB #232)

-                      Code (reserved=247748KB, committed=7608KB)
                            (malloc=60KB #1189) (peak=60KB #1188)
                            (mmap: reserved=247688KB, committed=7548KB)

-                        GC (reserved=82963KB, committed=44603KB)
                            (malloc=8959KB #582) (peak=8963KB #681)
                            (mmap: reserved=74004KB, committed=35644KB)

-    Native Memory Tracking (reserved=189KB, committed=189KB)
                            (malloc=4KB #61) (peak=13KB #160)
                            (tracking overhead=184KB)

-        Shared class space (reserved=16384KB, committed=12944KB, readonly=0KB)
                            (mmap: reserved=16384KB, committed=12944KB)

-                 Metaspace (reserved=65549KB, committed=333KB)
                            (malloc=13KB #10) (at peak)
                            (mmap: reserved=65536KB, committed=320KB)
4. Additional Tools
In addition to the tools already discussed, other options for monitoring JVM memory include Java Mission Control (JMC) and the Prometheus + Grafana stack.
Java Mission Control (JMC)
Java Mission Control is an advanced set of tools provided by Oracle for profiling and diagnostics of Java applications. It is tightly integrated with Java Flight Recorder (JFR) and provides low-overhead performance monitoring.
Prometheus + Grafana with JMX Exporter
For modern observability and dashboard-based monitoring, JVM metrics can be exported to Prometheus using the JMX Exporter. This exporter exposes JVM internals such as memory usage (including non-heap), thread counts, GC activity, and class loading as metrics in a Prometheus-friendly format. These metrics can then be visualized in Grafana, allowing teams to build rich, real-time dashboards that provide insight into JVM health, trends, and anomalies over time.
This approach is suited for distributed systems and cloud-native environments where centralized monitoring is essential.
5. Conclusion
In this article, we explored JVM non-heap memory monitoring with VisualVM, JConsole, jcmd, and modern observability tools. Understanding and tracking non-heap memory is essential for optimizing JVM performance and ensuring application stability.
6. Download the Source Code
This article explored how to monitor non-heap memory usage in the Java JVM.
You can download the full source code of this example here: java jvm monitor non-heap memory usage
