The Wiener process is a continuous-time stochastic process named in honor of Norbert Wiener. It’s commonly used to represent noise or financial development with a random component.
The geometric brownian motion can be calculated to visualize certain bounds (in quantiles) to hint about the absolute range. For calculation following parameters are required:
- µ (mu): mean percentage
- σ (sigma): variance
- t: time period
- v: Initial value
The extension to the regular calculation uses: m: Value increase per time period (in my case monthly value) breaks: Quantile breaks to calculate the bounds
Code to calculate the values:
import java.time.LocalDate;
import java.util.*;
import static java.lang.Math.sqrt;
import static java.lang.Math.exp;

public class WienerProcess {
    /**
     * Run the Wiener process for a given period and initial amount with a monthly value that is added every month. The
     * code calculates the projection of the value, a set of quantiles and the brownian geometric motion based on a
     * random walk.
     *
     * @param mu mean value (annualized)
     * @param sigma standard deviation (annualized)
     * @param years projection duration in years
     * @param initialValue the initial value
     * @param monthlyValue the value that is added per month
     * @param breaks quantile breaks
     * @return a List of double arrays containing the values per month for the given quantile breaks
     */
    public static List<double[]> getProjection(double mu, double sigma, int years, int initialValue,
        int monthlyValue, double[] breaks) {
        double periodizedMu = mu / 12;
        double periodizedSigma = sigma / Math.sqrt(12);
        int periods = years * 12;

        List<double[]> result = new ArrayList<double[]>();

        for (int i = 0; i < periods; i++) {
            double value = initialValue + (monthlyValue * i);
            NormalDistribution normalDistribution = new NormalDistribution(periodizedMu * (i + 1),
                    periodizedSigma * sqrt(i + 1));
            double bounds[] = new double[breaks.length];
            for (int j = 0; j < breaks.length; j++) {
                double normInv = normalDistribution.inverseCumulativeProbability(breaks[j]);
                bounds[j] = value * exp(normInv);
            }

            result.add(bounds);
        }
        return result;
    }
}
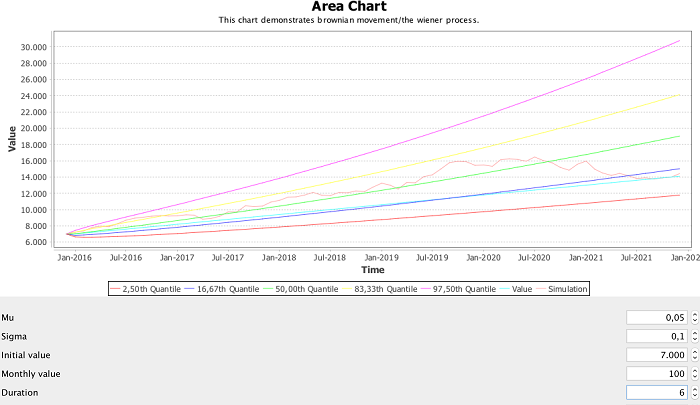
Applying the values:
- mu: 0.05 (or 5%)
- sigma: 0.1 (or 10%)
- initial value: 7000
- monthly increase: 100
- time period: 6 years
results in the following chart:
- The code is available from Github. It ships with a Swing GUI to enter values and to draw a chart based on the calculation. https://gist.github.com/mp911de/464c1e0e2d19dfc904a7
Related information
| Reference: | Geometric Brownian motion with Java from our JCG partner Mark Paluch at the paluch.biz blog. |
