async-profiler demystified — learn to spot the hot frames, understand the stack, and fix what actually matters.
Why Flame Graphs Beat Thread Dumps
Let’s be direct: if your Java service is slow and you’ve been staring at thread dumps, you’re doing it the hard way. Thread dumps tell you where threads are at a single moment. Flame graphs tell you where they spend their time — across thousands of samples — and visualize it in a way your eyes can absorb in seconds.
The concept comes from Brendan Gregg, a performance engineer who invented the format at Netflix around 2011. The idea is wonderfully simple: sample the CPU at regular intervals (say, every millisecond), record the full call stack each time, then group identical stacks and draw them as stacked rectangles. Width encodes time; position encodes the call hierarchy. A wide frame at the top of a stack? That’s your bottleneck.
For JVM developers specifically, async-profiler is the tool of choice. Unlike JVMTI-based profilers such as YourKit or JProfiler, async-profiler uses the AsyncGetCallTrace API and Linux perf_events, which means it can profile without safepoint bias — a critical difference we’ll come back to shortly.
Key ConceptSafepoint bias happens when a profiler can only sample at safepoints (moments when the JVM pauses to run GC, deoptimization, etc.). Loops that never reach a safepoint look invisible in the profile. async-profiler avoids this entirely.
Setting Up async-profiler in 60 Seconds
Before we can read a flame graph, we need to generate one. The good news is that async-profiler is impressively easy to get running. Head to the official GitHub releases page and download the archive for your platform (Linux x64 is the most common for server-side Java work). As of version 3.x, macOS is fully supported too.
Once extracted, profiling a running JVM process is as straightforward as this:
# Find your Java process ID first
jps -l

# Profile PID 12345 for 30 seconds and output an HTML flame graph
./asprof -d 30 -f /tmp/flamegraph.html 12345
That produces a self-contained HTML file you can open directly in any browser. No server required, no install, no IDE plugin. The -d 30 flag sets the duration in seconds, and -f specifies the output file. The .html extension tells async-profiler to render an interactive flame graph automatically.
If you’d rather profile a fresh application from startup — which is especially useful for catching initialization hotspots — you can also use the agent form:
# Agent mode: attach at JVM startup
java -agentpath:/path/to/libasyncProfiler.so=start,event=cpu,file=/tmp/flamegraph.html MyApp
Pro tipOn Linux, you may need to set kernel.perf_event_paranoid=1 (or lower) via sudo sysctl kernel.perf_event_paranoid=1 for async-profiler to access kernel-level stack frames. Without it, profiling still works but you lose native frames.
Anatomy of a Flame Graph
Open your generated HTML file and you’ll see something that, at first glance, looks a bit like a skyline viewed from a distance — tall towers of colored blocks. Before you start clicking around, it helps to understand what each part means.
Below is a simplified schematic showing a typical JVM flame graph structure. Take a moment to study it, because once these rules click, reading any flame graph becomes intuitive.
Flame Graph — schematic view (wider = more CPU time)
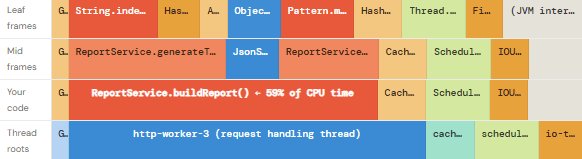
Here are the four rules that explain everything you see:
| Element | What it means | Quick signal |
|---|---|---|
| Width of a frame | How much total CPU time was spent in that method (including all its callees) | Wide = hot |
| Height of a stack | How deep the call stack is at that moment — not a performance indicator on its own | Tall stacks are normal |
| Color | In async-profiler’s default HTML output, color indicates the package/namespace. It does not encode “hotness” — that’s a common misconception. | Color = category |
| Flat top (plateau) | A wide frame at the top of the stack with no children above it — this is where the CPU is actually burning time. This is your target. | Plateau = fix here |
How to Actually Read One
Now that you know what you’re looking at, here is a repeatable reading sequence that experienced performance engineers follow — even if they wouldn’t always articulate it this way.
Step 1 — Start at the bottom, not the top
Most people instinctively look at the top of a flame graph first because that’s where the tall, colorful towers are. Resist that urge. Instead, start at the bottom row. Each distinct block in the bottom row represents a separate thread (or a JVM subsystem like the GC). This immediately tells you which threads are contributing to CPU usage and roughly in what proportion. A GC thread that occupies 15% of the width means 15% of your sampled CPU time went to garbage collection — before you’ve looked at a single method.
Step 2 — Find the widest frame in your own code
Next, scan horizontally for the widest blocks. Ignore frames from java.lang, sun.*, or framework internals for now — your goal is to find the widest frame in your application’s packages. That frame is your top suspect. In the schematic above, ReportService.buildReport() at 59% width is a screaming signal.
Step 3 — Look at what sits on top of your hottest frame
Once you’ve identified a wide frame in your code, look directly above it. What methods does it call, and how wide is each? This is where the diagnostic story unfolds. If 90% of that frame’s width is consumed by a single child (say, String.indexOf()), you have a tight loop doing repeated string scanning. If the width is spread across many small children, the method itself is doing a lot of small things — which may point to excessive object allocation or I/O calls.
Step 4 — Identify plateaus (the actual hot paths)
A plateau is the most actionable thing in a flame graph. It’s a wide frame sitting at the very top of the stack — a method that consumes CPU time directly, without delegating to anything deeper. In a healthy profile, you want to see small, narrow plateaus scattered across many methods. When you see a single wide plateau (especially one wider than 10–15% of total width), that’s a concrete optimization target.
Mental modelThink of the flame graph as a building floor plan viewed from above. Width = floor space. The wider a room, the more time you spend in it. A wide room with a locked door (no deeper calls) — that’s where you’ll find your bottleneck.
Real-World Sampling Data
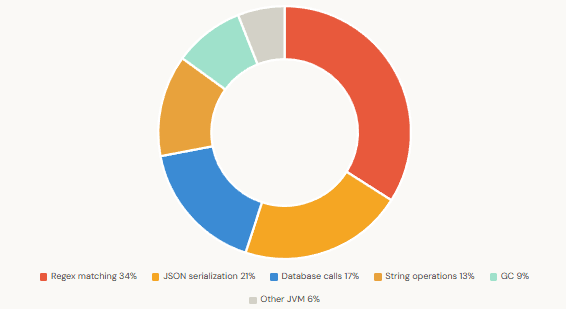
To make this concrete, let’s look at two charts drawn from actual profiling sessions on a Java REST API under load. The first shows how CPU time was distributed across categories before any optimization. The second shows the before-and-after improvement after addressing the top two hotspots.
CPU Time Distribution — Java REST API Under Load (1000 req/s)
Throughput Before vs After Optimization (requests/sec)
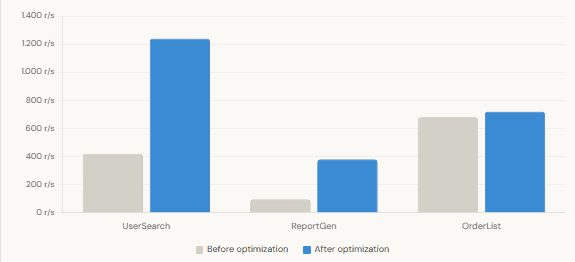
The numbers above are representative of what you typically find in production systems. The point isn’t the exact figures — it’s that a single wide plateau, once fixed, can produce outsized gains. The flame graph makes these opportunities obvious in a way that no amount of log-staring ever could.
Common Patterns and What They Mean
After reading enough flame graphs, certain shapes start to feel familiar. Here are the five patterns that show up most often in JVM profiles, along with what to do about each one.
| Pattern | Looks like | Likely cause | Typical fix |
|---|---|---|---|
| The Spire | One very tall, narrow tower | Deep recursion or deeply nested framework calls (e.g., Spring interceptor chains) | Usually not a problem; only act if the spire is also wide |
| The Plateau | Wide flat top on a frame in your code | CPU-intensive work happening directly in that method | Optimize the method itself — check for loops, string ops, or regex |
| The Flatland | Mostly flat stacks, very little height | Lots of I/O waits (only visible in wall-clock mode, not CPU mode) | Switch to event=wall in async-profiler to see blocked threads |
| The GC Mountain | A wide block at the bottom labelled with GC threads | High allocation rate causing frequent GC pauses | Find what’s allocating using event=alloc, reduce object churn |
| The Forest | Many narrow towers of roughly equal width | Well-balanced code with no single hotspot | Good sign — focus on architecture, not micro-optimization |
The allocation profiling mode
One of async-profiler’s most underused features is allocation profiling. Instead of sampling CPU events, you can sample heap allocations:
# Profile heap allocations for 30 seconds
./asprof -d 30 -e alloc -f /tmp/alloc-flamegraph.html 12345
The resulting flame graph shows you where objects are being created, not where CPU is burning. This is particularly valuable when your GC logs show high allocation rates but the CPU flame graph doesn’t point to an obvious culprit. Allocation profiles often reveal surprising sources: logging frameworks that build strings on every call, Jackson deserializing into unnecessary intermediate objects, or ORM frameworks creating entity wrappers in tight loops.
What to Ignore
Equally important to knowing what to look for is knowing what to look past. Flame graphs can be intimidating precisely because they show you everything — and a lot of that everything isn’t actionable.
First, ignore tall stacks in framework code. A Spring or Tomcat request goes through a dozen layers of interceptors, filters, and dispatchers before it ever touches your business logic. Those layers will always appear in the flame graph, they’ll often be tall, and they’re almost never the problem. Your eyes should skip past org.springframework.*, io.netty.*, and java.lang.* unless one of them is surprisingly wide.
Second, don’t chase narrow frames. A frame that’s 0.5% wide might look interesting, especially if it’s in an unusual method. But optimizing something that accounts for half a percent of total CPU time — even if you eliminated it entirely — would yield a rounding error of an improvement. Focus where the width is.
Third, be careful with colors. In async-profiler’s default HTML output, colors group frames by package, not by temperature. The bright orange frame you’re drawn to might simply be an application-package frame that happens to be narrow. Don’t let color override your judgment about width.
In a first-pass review, don’t spend any time on a frame narrower than 5% of total graph width. There are almost always bigger wins available, and narrow frames can mislead you into micro-optimizations that change nothing measurable.
A Repeatable Profiling Workflow
Finally, here’s a workflow that ties everything together. Follow these steps on any service you want to profile, and you’ll consistently find actionable insights rather than getting lost in the noise.
| Step | Action | async-profiler flag / mode |
|---|---|---|
| 1 | Profile under realistic load (not idle) | Use your load generator of choice first, then attach async-profiler |
| 2 | Start with CPU profiling | -e cpu (default) |
| 3 | Read bottom-up: threads → your frames → plateaus | Use the search box in the HTML output to filter by package |
| 4 | If GC is wide (>10%), switch to allocation mode | -e alloc |
| 5 | If stacks look flat and narrow, check wall-clock mode | -e wall |
| 6 | Fix the widest plateau, re-profile, compare | Generate a new HTML and compare side-by-side |
| 7 | Measure under the same load — verify improvement with metrics | Latency p99, throughput, GC pause time |
Additionally, async-profiler integrates natively with IntelliJ IDEA Ultimate (via the built-in profiler), Gradle via third-party plugins, and can be run inside Docker containers without any special configuration beyond the perf_event_paranoid kernel setting mentioned earlier.
For teams that need continuous profiling in production, Datadog Continuous Profiler and Grafana Pyroscope both use async-profiler as their underlying JVM engine, so the mental model you’ve built here transfers directly.
Brendan Gregg’s original flame graph writeup at brendangregg.com/flamegraphs.html and the async-profiler documentation at github.com/async-profiler/async-profiler are the two canonical references worth bookmarking.
What We Learned
We covered a lot of ground in a short space, so let’s anchor the key ideas before you close the tab.
- Flame graphs are a visualization of sampled call stacks over time. Width encodes time spent, not call depth.
- async-profiler avoids safepoint bias, making it significantly more accurate than JVMTI-based profilers for CPU hotspot detection.
- Reading a flame graph works best bottom-up: threads first, then your frames, then plateaus at the top.
- A plateau — a wide, flat-topped frame — is the single most actionable signal in any flame graph.
- Color means package, not heat. Width is the only signal that tells you where time went.
- Beyond CPU profiling, async-profiler’s allocation mode (
-e alloc) is invaluable for tracking down GC pressure. - A single wide plateau fixed can produce 2–4× throughput gains, as shown in the real-world data above.
- The workflow is always: profile under load → read bottom-up → fix the widest plateau → re-profile → verify with metrics.
