Structured Logging Has Been”Best Practice” for Five Years. Why Most Java Teams Are Still Doing It Wrong
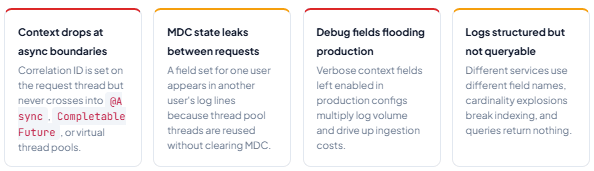
A diagnostic-focused look at the four failure modes nobody writes about: context lost across async boundaries, MDC leaks, log volume explosions, and logs that are structured but still unqueryable.
The conversation around structured logging in Java has been dominated by setup guides for years. How to configure Logback for JSON output. How to wire Log4j2 to an ELK stack. How to add an MDC field to your Logback pattern. All of that is useful — but it misses the part that actually bites teams in production. Getting your logs into JSON format is the easy step. Keeping context intact, avoiding data leaks, controlling volume, and making logs actually queryable — those are the parts that go wrong, repeatedly, at every scale.
This article does not walk you through setup. Instead, it walks through the four most common ways structured logging fails after the setup guide ends, with specific diagnostics for each one.
1. The Gap Between “Structured” and “Useful”
Switching a Java application to emit JSON logs is, genuinely, an improvement. Machine parsing becomes reliable, fields are addressable, and your log aggregator stops needing fragile Grok rules to extract a correlation ID from a sentence. That much is real.
The problem is that most teams stop there and call the job done. They tick the “structured logging” box on their engineering standards checklist, and then three months later they are staring at a production incident where half the log lines for a request are missing their traceId, another service’s userId has leaked into unrelated log lines, and the Kibana query they wrote to find all logs for a given correlation ID returns nothing because two services named the field differently.
These are not rare edge cases. They are the normal outcome of structured logging that was configured but not designed. Each one has a specific technical cause, and each one has a specific fix.
2. Correlation IDs Vanishing Across Async Boundaries
This is the failure mode that teams discover most painfully, usually during a production incident when they cannot trace a request end-to-end because the correlation ID disappears midway through the call graph.
The root cause is straightforward. Both SLF4J’s MDC (Mapped Diagnostic Context) and Log4j2’s ThreadContext are backed by ThreadLocal storage — meaning the data lives on a specific thread and is invisible to any other thread. When your code submits a Callable to an ExecutorService, calls an @Async-annotated Spring method, or chains a .thenApplyAsync() on a CompletableFuture, the new thread starts with a blank MDC. Your correlation ID does not cross that boundary automatically.
In practice, this shows up exactly as described in real Spring Boot migration work: a transactionId present in the first log line from the request thread is simply absent from subsequent lines produced by async workers — even when those workers are logically part of the same request.
The correct fix: wrap your executor, not your callables
The naive approach is to manually call MDC.put() inside every async task. That is fragile — it requires every developer who writes async code to remember the pattern, and it fails silently when they forget. The durable fix is to wrap the ExecutorService itself so that MDC propagation is automatic at the boundary, regardless of what the callable does.
The pattern is to capture a snapshot of the current MDC map before the task runs, restore it on the worker thread at execution time, and clear it in a finally block:
// MdcAwareExecutorService.java — wraps any ExecutorService
import org.slf4j.MDC;
import java.util.Map;
import java.util.concurrent.*;

public class MdcAwareExecutorService extends AbstractExecutorService {

    private final ExecutorService delegate;

    public MdcAwareExecutorService(ExecutorService delegate) {
        this.delegate = delegate;
    }

    @Override
    public void execute(Runnable command) {
        // Snapshot MDC state on the calling (request) thread
        Map<String, String> callerMdc = MDC.getCopyOfContextMap();

        delegate.execute(() -> {
            // Restore context on the worker thread
            if (callerMdc != null) MDC.setContextMap(callerMdc);
            try {
                command.run();
            } finally {
                MDC.clear(); // Never skip this — see the next section
            }
        });
    }

    // Delegate remaining lifecycle methods to the underlying executor...
    @Override public void shutdown()      { delegate.shutdown(); }
    @Override public List<Runnable> shutdownNow() { return delegate.shutdownNow(); }
    @Override public boolean isShutdown()  { return delegate.isShutdown(); }
    @Override public boolean isTerminated(){ return delegate.isTerminated(); }
    @Override public boolean awaitTermination(long timeout, TimeUnit unit)
        throws InterruptedException { return delegate.awaitTermination(timeout, unit); }
}
For Log4j2, the equivalent is CloseableThreadContext with .putAll(), which Apache’s official documentation demonstrates for thread pool use. The pattern is identical in intent: capture the map on the submitting thread, restore it on the worker, clean up unconditionally.
Virtual threads make this worse, not better
If your team is migrating to virtual threads (JDK 21+ with --enable-preview or JDK 25 stable), the problem deepens in a non-obvious way. Virtual threads do support ThreadLocal for backward compatibility — but when you use Structured Concurrency’s StructuredTaskScope.fork(), which is the idiomatic way to spawn child work in the Loom model, InheritableThreadLocal inheritance does not happen. As the OpenJDK team documented explicitly in the JEP 444 series: your MDC trace ID, your security context, your tenant identifier — all silently absent in the forked virtual thread.
The long-term fix for virtual thread applications is JEP 506 Scoped Values, finalized in JDK 25. Scoped Values are immutable, scope-bound, automatically available to all child tasks within a StructuredTaskScope, and carry zero copy overhead. They are the correct primitive for context propagation in a virtual-thread world — and logging frameworks will need to adopt them for MDC to work correctly at scale.
If your team enables virtual threads today (JDK 21–24),
ThreadLocal-based MDC still works for simple cases — but breaks silently underStructuredTaskScope.fork(). Run-Djdk.traceVirtualThreadLocals=trueduring load testing to surface hidden ThreadLocal access before it costs you in production.
3. MDC Cleanup Bugs That Silently Corrupt Your Logs
MDC leaks are arguably more dangerous than the async propagation problem, because they do not produce obviously missing data — they produce subtly wrong data. A field that should belong to user A’s request quietly appears in log lines for user B’s completely unrelated request. In a security-sensitive application, that can mean leaking a user ID, a tenant identifier, or an authentication token into logs that another user’s audit trail could surface.
The mechanism is simple. Thread pool threads are reused across many requests. If a request puts a value into MDC and then fails to clear it — because of an unhandled exception, a missing finally block, or a code path that was simply never tested — the MDC map stays populated on that thread. The next request handled by that thread inherits the previous request’s MDC state.
The finally block requirement
Every MDC write inside a request handler or async task must be paired with a MDC.clear() (or a more surgical MDC.remove(key) for individual fields) inside an unconditional finally block. No exceptions, no early returns. The pattern looks straightforward, but it fails in practice for two reasons:
- Teams use
try/catchwithoutfinally, meaning a thrown exception skips the cleanup entirely. - Library code that wraps execution (Spring’s
@Async, customTaskDecorators, servlet filters) sometimes clears some MDC keys but not all, leaving partial state behind.
Log4j2 offers a cleaner option for avoiding this class of bug entirely: CloseableThreadContext, which implements AutoCloseable and clears its own entries when the try-with-resources block exits — including on exception. For teams on Logback, the same result is achievable through a custom TaskDecorator registered with Spring’s ThreadPoolTaskExecutor.
// Log4j2 — CloseableThreadContext eliminates manual cleanup
try (CloseableThreadContext.Instance ctx =
        CloseableThreadContext
            .put("correlationId", requestId)
            .put("userId", userId)) {

    // All work here — context automatically cleared on exit,
    // even if an exception is thrown.
    service.processRequest(request);
}

// Logback — TaskDecorator approach for Spring thread pools
public class MdcTaskDecorator implements TaskDecorator {
    @Override
    public Runnable decorate(Runnable runnable) {
        Map<String, String> mdc = MDC.getCopyOfContextMap();
        return () -> {
            if (mdc != null) MDC.setContextMap(mdc);
            try { runnable.run(); }
            finally { MDC.clear(); }
        };
    }
}
Real bug pattern: A well-known SLF4J issue report documented that calling
MDC.clear()via the SLF4J adapter, rather than Log4j’s ownMDC.clear()directly, only cleared the HashMap contents but left the ThreadLocal reference itself intact — causing a memory leak on Tomcat reloads. Always verify you are calling the clear method on the correct implementation, not the facade.
4. Debug Fields Left in Production Configs — The Quiet Bill
This failure mode is less dramatic than leaked context, but it is the one most likely to show up as an unexpected line item on your cloud observability bill. It happens because structured logging makes it easy to add rich context to log events — and developers, quite reasonably, add a lot of it during development and debugging. The problem is that those fields rarely get removed when the code goes to production.
The consequence unfolds across two dimensions. First, log volume. A single additional field on every log event, at hundreds of events per second under production load, adds up faster than intuition suggests. Second, and often worse, is cardinality. Fields like userId, requestId, sessionId, and full requestUrl values have essentially unbounded cardinality — every distinct value creates a new entry in your log indexer’s term dictionary. Platforms like Elasticsearch degrade noticeably when indexed fields have millions of distinct values; query latency rises, storage costs climb, and the very queryability you adopted structured logging to gain starts to erode.
Relative cost of indexed log fields by cardinality type

The rule: separate what you index from what you store
The practical principle here, as articulated clearly by practitioners at Honeycomb and elsewhere, is to treat indexed log fields like database columns and stored-but-not-indexed fields like row data. Low-cardinality dimensions — environment, service name, cluster, region, severity — make excellent indexed fields because they slice cleanly and cheaply. High-cardinality fields — user IDs, request IDs, correlation IDs, session tokens — are valuable for debugging individual incidents but should be stored in the log payload without being indexed as top-level dimensions.
| Field Type | Examples | Cardinality | Index? | Notes |
|---|---|---|---|---|
| Good index candidate | env, region, service | Low (<1,000) | Yes | Enables efficient aggregation and dashboard queries |
| Store, don’t index | correlationId, userId | High (millions) | As keyword, not analyzed | Useful for point-in-time lookup; destructive to index if analyzed |
| Truncate or hash | requestUrl, queryString | Unbounded | Never full value | Hash or trim to path only; full URLs explode index size |
| Production: remove or sample | requestBody, full stack traces per event | Unbounded | No | Log at ERROR with sampling; never emit on every request |
Additionally, log-level discipline matters more than most teams acknowledge. A log configuration that emits DEBUG output to a shipped appender in production is not an unusual mistake — it is a common one. A straightforward audit of your logback.xml or log4j2.xml appender configurations, checking that the root logger’s effective level is INFO or above in production profiles, can cut log volume by 60–80 percent in applications that have accumulated verbose logging over years of development.
5. Structured But Not Queryable: The Field Schema Problem
This is the subtlest of the four failure modes, and the one that takes longest to discover. Your logs are structured. They are being shipped to Elasticsearch or a similar backend. Individual log events look correct when you inspect them. And yet, when you try to write a query that spans multiple services — “find all log lines related to correlation ID X” or “show me every ERROR event for user Y across the payment and order services” — the results are incomplete, inconsistent, or empty.
The cause is almost always a field schema problem. Different services in the same system have independently named the same logical fields in different ways. One service emits correlationId, another emits correlation_id, a third emits requestId, and a fourth emits traceId meaning the same thing. Elasticsearch maps each as a separate field. Your query against correlationId simply does not match the events from two of your four services, silently.
Dot notation in Elasticsearch is not what you think
There is a related trap specific to Elasticsearch and OpenSearch that even experienced teams fall into. As Elastic’s own ECS logging documentation warns: dots in JSON field names and nested JSON objects with the same keys produce identical Elasticsearch mappings. A field emitted as {"http.method": "GET"} and a field emitted as {"http": {"method": "GET"}} create the same mapping entry — but the second form can conflict with an existing string mapping on http, causing a mapping conflict exception that silently drops the document. If your logs are occasionally disappearing from your backend and you cannot see why, mapping conflicts are a very likely cause.
# These two JSON structures produce the SAME Elasticsearch mapping,
# but the second can cause mapping conflicts if 'http' is already typed

# Form 1 — flat dot notation (generally safer)
{ "http.method": "GET", "http.status_code": 200 }

# Form 2 — nested JSON (can conflict with existing string mapping on 'http')
{ "http": { "method": "GET", "status_code": 200 } }

# ECS recommendation: prefix custom fields with 'labels.' or 'custom.'
{ "labels.tenantId": "acme-corp", "labels.featureFlag": "checkout-v2" }
Treat your log schema like a contract
The durable solution is to treat log field names as a shared contract across services — the same way you would treat a public API schema. Concretely, that means agreeing on a canonical set of field names early, documenting them in the same place you document other shared contracts (an ADR, a service handbook, an OpenTelemetry semantic conventions reference), and enforcing them through a shared logging library rather than relying on every service author to remember the list.
Common field naming inconsistencies across microservices

OpenTelemetry’s Semantic Conventions are the most practically useful reference for this today. They define canonical names for common fields — http.request.method, service.name, error.type — and adopting them means your logs align with your traces and metrics, enabling genuine correlation across all three signals rather than just within the log stream.
Run a query across your log backend for the same logical field with the five most likely naming variants your team might have used. If more than one variant returns results, you have a schema consistency problem. Fix the emitter, not the query — dashboards built on inconsistent field names become a maintenance burden that compounds over time.
6. What We Have Learned
Structured logging is genuinely valuable — but the value is conditional on getting four things right that setup guides do not cover. First, correlation context must propagate explicitly across every async boundary: thread pools, CompletableFuture chains, @Async methods, and virtual thread scopes all require deliberate wrappers or Scoped Values to carry MDC state across the boundary. Second, every MDC write must have an unconditional finally-block cleanup; leaking context across requests produces subtly wrong data that is harder to detect than missing data.
Third, debug-level richness needs to be quarantined from production appenders — high-cardinality indexed fields silently degrade query performance and inflate ingestion costs at a rate that only becomes obvious months after the configuration was written. And fourth, JSON output is not the same as a queryable schema: field names must be agreed across services as a shared contract, because a query that only matches half your services is worse than no query at all, since it creates false confidence. Together, these four disciplines are what separate logs that are structured on paper from logs that are genuinely useful when something goes wrong at two in the morning.
