The Classloading Graph: Why Your Spring Boot App’s Startup Time Is a Classloading Problem and Not a Bean Problem
Startup time is nearly always blamed on bean initialisation. The actual bottleneck is usually classloading — a graph traversal problem that most engineers never see because nothing surfaces it.
If you have ever profiled a slow Spring Boot startup and jumped straight to “which beans are taking longest?”, you are not alone — and you are also probably looking at the wrong thing. The bean initialisation phase is visible, measurable, and easy to reason about. Classloading, on the other hand, is a quiet, sequential, often misunderstood graph traversal happening underneath every startup, and it is almost never the first thing engineers investigate.
This article breaks down exactly why that is, how the JVM’s classloader hierarchy works, what Spring Boot does on top of it, and — crucially — what you can actually do about it. Transition words and clear structure will help you follow along, but the real goal here is to give you a mental model you can apply the next time your app takes four seconds to boot when it should take one.

1. First, Let’s Agree on What “Startup” Actually Means
When engineers say “startup is slow,” they almost always mean the time from java -jar to the first log line that says the application is ready. Inside that window, however, there are actually several distinct phases happening in sequence. Understanding which phase is expensive is the entire game.
Broadly, the JVM startup sequence looks like this: first, the JVM itself initialises. Then the application’s classloader hierarchy is set up. Then classes are loaded, verified, and resolved. Only after a class is loaded can it be instantiated — and only after instantiation can beans be registered, wired, and started. In other words, classloading is not a consequence of the Spring application context; it is a prerequisite for it.
Key Insight
Classloading gates everything. No bean can initialise before its class is loaded. No class can be linked before its dependencies are resolved. This makes classloading the critical path in a way that bean initialisation simply isn’t — because many beans can initialise in parallel, but classloading follows a strict delegation chain that is, by default, sequential.
2. The Classloader Hierarchy: A Tree You Are Always Traversing
The JVM does not use a single classloader. Instead, it uses a delegation model with a parent-first hierarchy, and understanding this tree is the foundation of everything else in this article. There are three core classloaders in modern Java (9+), and Spring Boot adds a fourth on top of them.
| Classloader | Responsibility | In Java 9+ | Startup Impact |
|---|---|---|---|
| Bootstrap | Core JVM classes (java.lang.*, java.util.*) | Built into the JVM, written in C | Low — cached early |
| Platform (Extension) | Platform modules (java.se, java.xml, etc.) | Replaced by module system | Low — module resolution |
| Application (System) | Your app’s classpath | Loads from --class-path | Medium — classpath scanning |
| LaunchedURLClassLoader | Loads from inside the fat JAR | Spring Boot specific | High — nested JAR scanning |
The delegation model works like this: when the JVM needs to load a class, it asks the current classloader first — but before the current classloader tries to load anything itself, it delegates to its parent. That parent also delegates upward. Only after the top of the chain (Bootstrap) fails to find the class does control flow back down. This means that loading even a single class can result in a chain of lookups across four classloaders, each potentially scanning its classpath.
Importantly, this process is not free. Each lookup involves filesystem I/O (or ZIP entry scanning), class verification, and bytecode parsing. Furthermore, the standard JDK classloaders are, to this day, synchronised on a per-classloader basis via a shared lock for the loading step, which means that in a single-threaded loading scenario, you are walking this tree one class at a time.
2.1 Why Spring Boot Makes This Harder
A traditional Spring application deployed as a WAR to a servlet container externalises a lot of this complexity — the container manages the classloader. Spring Boot’s executable fat JAR, however, bundles all dependencies inside the JAR itself, which means Spring Boot needs its own classloader: LaunchedURLClassLoader. This classloader is responsible for reading classes out of nested JARs within the fat JAR — a significantly more expensive operation than reading from a standard flat classpath.
Moreover, as Spring Boot scans for components, it does not just load classes — it loads them, inspects their annotations, and then potentially loads more classes based on what it finds. This is the classloading graph: each node is a class, and each directed edge is a “this class references that class, so that class must also be loaded.” Component scanning turns this from a shallow tree into a deep, wide graph traversal.
3. The Delegation Model in Practice: A Graph Walk
Let’s make this concrete. Consider what happens when Spring tries to load a @Service class that depends on an interface, which is implemented by a class in another library, which in turn references a class from a third-party dependency. In graph terms, you have a chain of at least four nodes, each requiring a full delegation walk before the next one can begin. That is a conservative example — real dependency chains in Spring apps routinely go six to ten levels deep.
Startup Time Breakdown: Classloading vs Bean Initialisation
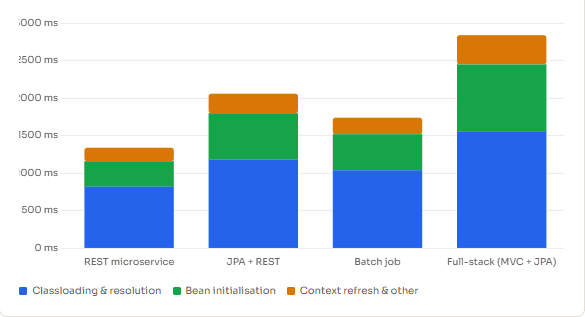
What the chart above illustrates is worth pausing on: classloading consistently accounts for a substantial portion of startup time, and in smaller, “lighter” applications, it actually dominates over bean initialisation. The reason is that bean count scales with your application’s code, but class count scales with your dependencies — and most Spring Boot applications pull in hundreds of transitive dependencies.
Common Misconception
Reducing the number of @Bean methods or switching to lazy initialisation can help startup time — but if the underlying classes are still being loaded to evaluate conditions, the improvement will be smaller than expected. spring.main.lazy-initialization=true defers bean creation, not class loading.
4. Parallel Classloading: Not Always the Answer
Java has supported parallel-capable classloaders since Java 7 via ClassLoader.registerAsParallelCapable(). When enabled, classloaders use per-class locks rather than a single classloader-level lock, which theoretically allows multiple classes to be loaded concurrently. In practice, however, this is more nuanced than it sounds.
First, parallelism here refers to loading, not initialisation. Class initialisation (the <clinit> method, i.e., static blocks and field assignments) is still strictly sequential per class. More importantly, if your initialisation graph has many classes whose static initialisers reference each other, parallel loading can actually introduce deadlocks via circular dependencies in the initialisation order — a famously tricky failure mode that only appears under concurrency.
Second, Spring Boot’s LaunchedURLClassLoader does register as parallel-capable. But because it is reading from a nested JAR, the actual I/O operations are serialised at the ZIP file level regardless — the class-level locking improvement only matters when the bottleneck is lock contention, not raw I/O throughput.
| Scenario | Does Parallel Classloading Help? | Why / Why Not |
|---|---|---|
| Many unrelated libraries | Yes, meaningfully | No shared state, concurrent loading possible |
| Deep inheritance chains | No | Parent must be loaded before child — serial constraint |
| Circular static init | Dangerous | Risk of ClassInitializationError or deadlock |
| Fat JAR (nested ZIPs) | Limited | I/O bottleneck, not lock contention |
| Exploded JAR on SSD | Yes, significantly | Parallel I/O is fast; lock reduction helps |
5. Spring Boot Patterns That Cause Unnecessary Classloading Chains
Now that we understand the mechanism, let’s talk about the specific patterns in Spring Boot applications that make classloading chains longer than they need to be. These are not bugs — they are natural consequences of how Spring Boot’s auto-configuration model works. However, knowing them lets you make smarter trade-offs.
1. Component Scanning Wide Package Trees
When you annotate your main class with @SpringBootApplication, Spring scans the package of that class and all sub-packages for components. If your main class is in a root package like com.mycompany, you are asking Spring to potentially scan and reflectively inspect every class in every package under that root. Even classes that don’t end up as beans must be opened, read, and evaluated for annotations before Spring can decide to skip them.
Therefore, placing your main class higher up the package tree than necessary is one of the cheapest ways to create unnecessary classloading chains. The fix is to narrow the scan: either move your main class deeper, or use @ComponentScan(basePackages = "...") explicitly to constrain the search space.
2. Auto-configuration Conditions Still Load Classes
Spring Boot’s auto-configuration mechanism relies on @Conditional annotations to decide which beans to create. A common misconception is that a negative condition — where a bean is not created — means the relevant classes were not loaded. This is often wrong.
@ConditionalOnClass is the notable exception; it specifically checks for class presence without loading the class itself (it uses the classloader’s findResource instead of loadClass). However, @ConditionalOnBean, @ConditionalOnProperty, and many others evaluate their conditions against beans and properties that have already been resolved — meaning the configuration classes themselves have already been loaded. Even when the auto-configuration ultimately creates nothing, it has still triggered classloading of the configuration infrastructure.
3. Fat JAR Scanning vs Exploded Archives
The difference in classloading performance between a fat JAR and an exploded archive is significant and often overlooked in containerised deployments. When your application runs as a fat JAR, every class load from a dependency requires Spring Boot to navigate the nested ZIP structure, locate the entry, and decompress it. When the same JAR is exploded into a directory on the filesystem — which is what the official Spring Boot Docker layering encourages — class reads are direct filesystem accesses, which are significantly faster, especially in Docker environments with Union FS layers.
Consequently, simply switching to an exploded JAR layout in your container image — with the dependencies in a separate layer — can reduce classloading time by 20–40% in I/O-bound environments, without changing a single line of application code.
4. Reflection-heavy Libraries Triggering Cascading Loads
Libraries that make heavy use of reflection at startup — ORM frameworks, serialisation libraries, AOP proxies — are classloading multipliers. A single Hibernate entity scan, for example, can trigger loading of dozens of classes per entity: the entity itself, its superclasses, all referenced types, all enumeration types, and the proxy class Spring generates for lazy loading. When you have 50 entities, that multiplication adds up quickly.
Classes Loaded Per Startup Phase (Typical Spring Boot + JPA App)
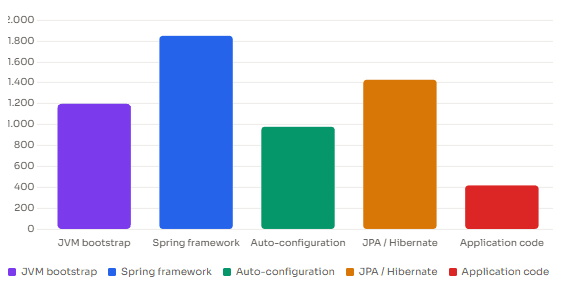
-verbose:class flag, grouped by phase. Numbers will vary by application size.6. What You Can Actually Do About It
Understanding the problem is valuable, but let’s be practical. There are several concrete strategies, ordered roughly from highest to lowest effort, that genuinely address classloading overhead rather than just deferring it.
6.1 Use Class Data Sharing (CDS) and AppCDS
Class Data Sharing, available since Java 13 in its application form (AppCDS), allows the JVM to pre-process a set of classes and store the parsed bytecode, verified class metadata, and resolved references in a shared archive. On subsequent runs, the JVM maps this archive into memory directly, skipping the load-verify-resolve cycle entirely for all archived classes.
For a Spring Boot app running on JDK 21+, enabling CDS with a training run can reduce startup time by 30–50% in production-like environments. Spring Boot 3.3+ has built-in support for CDS — you can generate and use the archive with minimal configuration.
To generate a CDS archive for a Spring Boot application, you can run a training invocation with:
java -XX:ArchiveClassesAtExit=app.jsa \
     -Dspring.context.exit=onRefresh \
     -jar myapp.jar
Then use the archive in production:
java -XX:SharedArchiveFile=app.jsa -jar myapp.jar
Note: the spring.context.exit=onRefresh property (introduced in Spring Framework 6.1) shuts the app down immediately after the context refreshes, making it suitable for archive generation without running your full application logic.
Quick Win
If you are on Spring Boot 3.3+ with JDK 21+, CDS support is the single highest-leverage change you can make for startup time. It requires no code changes, addresses classloading directly at the source, and the archive is reproducible across deployments.
6.2 Profile with -verbose:class Before Optimising
Before reaching for any other tool, add -verbose:class to your JVM arguments. This flag causes the JVM to print every class it loads to stdout, including which classloader loaded it. The output is verbose (hence the name), but it is the ground truth. Pipe it through a simple wc -l to get total class count, or filter it to see which packages contribute most.
java -verbose:class -jar myapp.jar 2>&1 | grep "\[Loaded" | wc -l
For a more structured view, the JetBrains IntelliJ IDEA profiler and JFR (Java Flight Recorder) both capture classloading events with timing data, letting you see not just what was loaded but how long each load took and from which thread it was initiated.
6.3 Narrow Component Scan and Exclude Unused Auto-configurations
Two of the most straightforward application-level changes are narrowing your component scan scope (as described above) and explicitly excluding Spring Boot auto-configurations you know you do not need. The spring.autoconfigure.exclude property, or the exclude attribute on @SpringBootApplication, prevents entire configuration classes from being processed — and by extension, prevents the classloading those configurations would have triggered.
# In application.properties — exclude auto-configs you don't need
spring.autoconfigure.exclude=\
  org.springframework.boot.autoconfigure.jmx.JmxAutoConfiguration,\
  org.springframework.boot.autoconfigure.admin.SpringApplicationAdminJmxAutoConfiguration
To discover which auto-configurations are being applied to your app and which ones are being skipped, run your application with:
java -Ddebug=true -jar myapp.jar 2>&1 | grep -A 1 "Positive matches"
6.4 Consider GraalVM Native Image for the Most Aggressive Reduction
If startup time is a hard requirement — for instance, in serverless or CLI tooling scenarios — GraalVM Native Image eliminates classloading at runtime entirely. By performing a closed-world analysis at build time, it resolves all class references ahead of time and compiles everything into a single native binary. Spring Boot 3+ has first-class support for this via Spring AOT processing.
The trade-off is significant, though: native compilation is slow (minutes rather than seconds), requires all reflection usage to be declared at build time, and does not support dynamic class generation at runtime. For long-running services, JVM with CDS is usually the better balance.
7. What We Have Learned
Spring Boot startup time is, at its core, a classloading problem dressed up as a bean problem. The JVM’s parent-first delegation model means that loading a single class involves traversing a four-level classloader hierarchy before any class data is actually read. Spring Boot’s fat JAR architecture then adds a fifth layer of I/O complexity with nested ZIP scanning. On top of all that, Spring’s component scan and auto-configuration machinery trigger wide, deep classloading graph traversals — loading thousands of classes before a single bean is ever initialised.
Parallel classloading is not a silver bullet: it helps in I/O-concurrent scenarios but provides no benefit when the bottleneck is serial delegation chains, and it can introduce subtle deadlocks in class initialisation order. The most effective tools — AppCDS, exploded JARs, narrow component scanning, and auto-configuration exclusions — all address the classloading graph directly rather than working around it. Measure first with -verbose:class or JFR, then pick the intervention that matches the actual bottleneck in your app.
