Modern software systems are increasingly complex, with applications spanning multiple services, containers, and cloud platforms. When issues arise—and they inevitably will—engineers need visibility into what’s happening across their distributed architecture. This is where observability comes in, and OpenTelemetry has emerged as the industry standard for implementing it.
OpenTelemetry, often abbreviated as OTel, is an open-source observability framework that provides a unified approach to collecting telemetry data from your applications. Born from the merger of OpenTracing and OpenCensus in 2019, it’s now a Cloud Native Computing Foundation (CNCF) project with widespread adoption across the industry.
1. Understanding the Three Pillars of Observability
Before diving into implementation, it’s essential to understand what observability actually means. The concept rests on three fundamental pillars, each providing a different lens through which to view your system’s behavior.
Distributed Tracing allows you to follow a single request as it travels through your entire system. Imagine ordering a product online—that single action might trigger dozens of service calls: authentication, inventory checks, payment processing, and shipping coordination. Tracing connects all these operations, showing you the complete journey and where time is being spent.
Metrics provide the numerical measurements of your system’s behavior over time. These are your counters, gauges, and histograms—things like request rates, error percentages, CPU utilization, and response times. Metrics give you the quantitative data needed to understand system health and performance trends.
Logging captures discrete events that happen within your application. While metrics tell you that error rates increased, logs tell you exactly what errors occurred, with full context about what the application was doing at that moment. Structured logs, in particular, make it possible to query and analyze these events programmatically.
Together, these three pillars create a comprehensive view of your system. Metrics alert you to problems, traces help you understand the flow and identify bottlenecks, and logs provide the detailed context needed for debugging.
2. Why OpenTelemetry Matters
The observability landscape has historically been fragmented. Different vendors provided incompatible agents, SDKs, and data formats. This created vendor lock-in and made it difficult to switch observability backends without rewriting significant portions of your instrumentation code.
OpenTelemetry solves this problem by providing a vendor-neutral standard. You instrument your code once using OpenTelemetry, and the data can be sent to any compatible backend—whether that’s Prometheus, Jaeger, Grafana, commercial solutions like Datadog or New Relic, or your own custom pipeline.
The framework also offers both automatic and manual instrumentation options. Automatic instrumentation can capture telemetry without code changes for many popular frameworks and libraries, while manual instrumentation gives you fine-grained control over exactly what data is collected.
3. Getting Started: Core Concepts
OpenTelemetry’s architecture consists of several key components that work together to collect and export telemetry data.
The OpenTelemetry SDK is the implementation library you use in your application code. It provides the APIs for creating traces, recording metrics, and emitting logs. SDKs are available for most major programming languages including Java, Python, JavaScript, Go, .NET, and many others.
Instrumentation libraries are pre-built packages that automatically capture telemetry from popular frameworks and libraries. For example, the HTTP instrumentation library can automatically trace incoming and outgoing HTTP requests without you writing any tracing code.
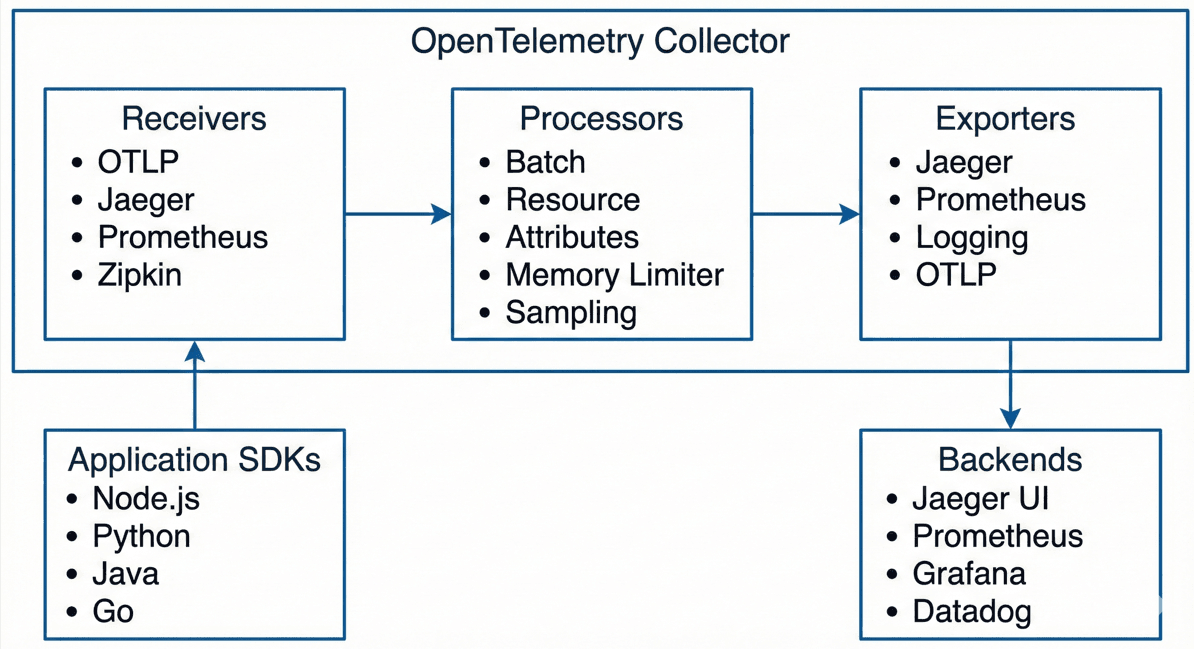
The OpenTelemetry Collector is a standalone service that receives, processes, and exports telemetry data. It acts as a central aggregation point, allowing you to decouple data collection from data destination. The Collector can batch data, add additional attributes, filter sensitive information, and route data to multiple backends simultaneously.
Exporters are plugins that send telemetry data to specific backends. OpenTelemetry includes exporters for all major observability platforms, and you can write custom exporters if needed.
4. Implementing Distributed Tracing
Let’s walk through implementing distributed tracing in a practical example. We’ll use a Node.js application, but the concepts translate to any language.
First, install the required packages. Note: We include the metrics exporter here so the dependencies are ready for later steps.
npm install @opentelemetry/sdk-node \
  @opentelemetry/api \
  @opentelemetry/auto-instrumentations-node \
  @opentelemetry/exporter-trace-otlp-http \
  @opentelemetry/exporter-metrics-otlp-http \
  @opentelemetry/resources \
  @opentelemetry/semantic-conventions
Create an instrumentation file that will initialize the SDK before your application code runs:
// instrumentation.js
const { NodeSDK } = require('@opentelemetry/sdk-node');
const { getNodeAutoInstrumentations } = require('@opentelemetry/auto-instrumentations-node');
const { OTLPTraceExporter } = require('@opentelemetry/exporter-trace-otlp-http');
const { Resource } = require('@opentelemetry/resources');
const { ATTR_SERVICE_NAME, ATTR_SERVICE_VERSION } = require('@opentelemetry/semantic-conventions');

const sdk = new NodeSDK({
  resource: new Resource({
    [ATTR_SERVICE_NAME]: 'my-service',
    [ATTR_SERVICE_VERSION]: '1.0.0',
  }),
  traceExporter: new OTLPTraceExporter({
    // Assumes local collector is running on port 4318 (HTTP)
    url: 'http://localhost:4318/v1/traces',
  }),
  instrumentations: [getNodeAutoInstrumentations()],
});

sdk.start();

// Gracefully shut down the SDK on process exit
process.on('SIGTERM', () => {
  sdk.shutdown()
    .then(() => console.log('Tracing terminated'))
    .catch((error) => console.log('Error terminating tracing', error))
    .finally(() => process.exit(0));
});
Run your application with the --require flag to ensure the SDK loads first:
node --require ./instrumentation.js app.js
This configuration automatically instruments HTTP, Express, and many other popular libraries. Every HTTP request your application handles will generate a trace span with relevant details like HTTP method, URL, status code, and duration.
For custom instrumentation, you can manually create spans:
const { trace, SpanStatusCode } = require('@opentelemetry/api');

async function processOrder(orderId) {
  // Get the tracer using the name of your service or library
  const tracer = trace.getTracer('order-service');

  return tracer.startActiveSpan('processOrder', async (span) => {
    try {
      span.setAttribute('order.id', orderId);
      span.setAttribute('order.type', 'online');

      // Your business logic here
      // These functions will automatically be nested if they also use tracing
      await validateOrder(orderId);
      await chargePayment(orderId);
      await scheduleShipment(orderId);

      span.setStatus({ code: SpanStatusCode.OK });
      return { success: true };
    } catch (error) {
      span.recordException(error);
      span.setStatus({
        code: SpanStatusCode.ERROR,
        message: error.message
      });
      throw error;
    } finally {
      span.end();
    }
  });
}
Table 1: Automatic vs Manual Instrumentation
| Feature | Automatic Instrumentation | Manual Instrumentation |
|---|---|---|
| Setup Effort | Minimal – just install packages | Moderate – requires code changes |
| Coverage | Covers common frameworks/libraries | Covers specific business logic |
| Customization | Limited to configuration options | Full control over span attributes |
| Performance Overhead | May capture more than needed | Optimized for specific use cases |
| Maintenance | Updates automatically with packages | Requires manual updates |
| Best For | Getting started quickly, standard operations | Business-critical paths, custom metrics |
5. Collecting and Analyzing Metrics
Metrics complement tracing by providing aggregated measurements over time. OpenTelemetry supports three fundamental metric types:
- Counters: Monotonically increasing values (e.g., total requests).
- Gauges: Values that can go up or down (e.g., memory usage).
- Histograms: Distributions of values (e.g., request duration).
To add metrics to your existing instrumentation.js, you update the NodeSDK configuration to include a metric reader:
// Update to instrumentation.js
const { PeriodicExportingMetricReader } = require('@opentelemetry/sdk-metrics');
const { OTLPMetricExporter } = require('@opentelemetry/exporter-metrics-otlp-http');

const sdk = new NodeSDK({
  // ... resource config from previous step ...
  traceExporter: new OTLPTraceExporter({
    url: 'http://localhost:4318/v1/traces',
  }),
  // Add the metric reader here
  metricReader: new PeriodicExportingMetricReader({
    exporter: new OTLPMetricExporter({
      url: 'http://localhost:4318/v1/metrics',
    }),
    exportIntervalMillis: 60000, // Export every 60 seconds
  }),
  instrumentations: [getNodeAutoInstrumentations()],
});
Now create and use custom metrics in your application:
const { metrics } = require('@opentelemetry/api');

// Get a meter instance
const meter = metrics.getMeter('my-service-metrics');

// Counter for total requests
const requestCounter = meter.createCounter('http.server.requests', {
  description: 'Total HTTP requests',
  unit: '{request}',
});

// Histogram for request duration
const requestDuration = meter.createHistogram('http.server.duration', {
  description: 'HTTP request duration',
  unit: 'ms',
});

// Observable Gauge for active connections
const activeConnectionsGauge = meter.createObservableGauge(
  'http.server.active_connections',
  {
    description: 'Number of active HTTP connections',
    unit: '{connection}',
  }
);

// Callback to report gauge value
let activeConnections = 0;
activeConnectionsGauge.addCallback((observableResult) => {
  observableResult.observe(activeConnections);
});

// Example usage in Express middleware
// app.use((req, res, next) => { ... logic to increment/decrement ... });
Note how attributes (also called labels or tags) are added to metrics. These dimensions allow you to slice and dice your metrics data—for example, viewing error rates by HTTP method or response times by endpoint.
6. Structured Logging with OpenTelemetry
OpenTelemetry’s logging support allows for automatic trace context injection. When your application emits a log within a traced operation, OpenTelemetry can automatically add the trace_id and span_id.
Here’s an example using Winston:
const winston = require('winston');
const { trace, context } = require('@opentelemetry/api');

// Create a custom format that adds trace context
const traceFormat = winston.format((info) => {
  const span = trace.getSpan(context.active());
  if (span) {
    const spanContext = span.spanContext();
    info.trace_id = spanContext.traceId;
    info.span_id = spanContext.spanId;
    // info.trace_flags indicates if the trace is sampled
    info.trace_flags = `0${spanContext.traceFlags.toString(16)}`;
  }
  return info;
});

const logger = winston.createLogger({
  level: 'info',
  format: winston.format.combine(
    traceFormat(),
    winston.format.timestamp(),
    winston.format.json()
  ),
  transports: [new winston.transports.Console()],
});

// Logs will now look like:
// {"level":"info","message":"User logged in","trace_id":"...","span_id":"...","timestamp":"..."}
7. Setting Up the OpenTelemetry Collector
While you can send telemetry directly from your applications to backends, using the OpenTelemetry Collector is highly recommended. It acts as a middleware that can clean, batch, and route data.
Here is a modern, working otel-collector-config.yaml. Note that we use the debug exporter (which replaces the deprecated logging exporter in newer versions) to see data in the console.
# otel-collector-config.yaml
receivers:
  otlp:
    protocols:
      grpc:
        endpoint: 0.0.0.0:4317
      http:
        endpoint: 0.0.0.0:4318

processors:
  batch:
    timeout: 10s
    send_batch_size: 1024

  # Adds an environment tag to all data
  resource:
    attributes:
      - key: environment
        value: production
        action: upsert

  # Removes sensitive data
  attributes:
    actions:
      - key: sensitive_data
        action: delete
      - key: password
        action: delete

exporters:
  # Export traces to Jaeger
  otlp/jaeger:
    endpoint: jaeger:4317
    tls:
      insecure: true

  # Expose metrics for Prometheus to scrape
  prometheus:
    endpoint: 0.0.0.0:8889

  # Print to console (formerly 'logging' exporter)
  debug:
    verbosity: detailed

service:
  pipelines:
    traces:
      receivers: [otlp]
      processors: [batch, resource, attributes]
      exporters: [otlp/jaeger, debug]

    metrics:
      receivers: [otlp]
      processors: [batch, resource]
      exporters: [prometheus, debug]
Run the Collector using Docker:
docker run -p 4317:4317 -p 4318:4318 -p 8889:8889 \
  -v $(pwd)/otel-collector-config.yaml:/etc/otel-collector-config.yaml \
  otel/opentelemetry-collector:latest \
  --config=/etc/otel-collector-config.yaml
8. Context Propagation Across Services
Distributed tracing relies on “Context Propagation”—passing the Trace ID from one service to another. OpenTelemetry uses the W3C Trace Context standard (headers traceparent and tracestate).
Automatic instrumentation handles this for HTTP/GRPC. For manual message queues (like RabbitMQ or Kafka), you must inject the context:
const { propagation, context } = require('@opentelemetry/api');

// INJECTING context into a message (Producer)
async function publishMessage(message) {
  const carrier = {};
  // Injects traceparent header into the carrier object
  propagation.inject(context.active(), carrier);

  await messageQueue.publish({
    ...message,
    metadata: carrier,
  });
}

// EXTRACTING context from a message (Consumer)
async function handleMessage(message) {
  // Extract traceparent from metadata
  const extractedContext = propagation.extract(
    context.active(),
    message.metadata
  );

  // Run the processing logic inside the extracted context
  return context.with(extractedContext, async () => {
    // New spans created here will automatically be children of the Producer's trace
    const span = trace.getTracer('consumer').startSpan('process_message');
    // ... processing logic ...
    span.end();
  });
}
9. Best Practices for Production Deployments
Implementing OpenTelemetry successfully requires thoughtful planning and adherence to best practices. Here are key considerations for production systems.
Sample your data intelligently. In high-throughput systems, tracing every single request can be prohibitively expensive. Implement sampling strategies that capture enough data for observability without overwhelming your systems. Tail-based sampling is particularly powerful—it makes sampling decisions after traces complete, allowing you to keep all error traces while sampling successful ones at a lower rate.
Use semantic conventions. OpenTelemetry defines semantic conventions for common attributes like HTTP methods, database queries, and messaging operations. Following these conventions ensures consistency across your telemetry and enables better cross-service analysis.
Implement resource detection. Automatically detect and attach resource information like cloud provider, Kubernetes pod details, and host information. OpenTelemetry provides resource detectors for common environments:
const { detectResourcesSync } = require('@opentelemetry/resources');
const {
  envDetectorSync,
  hostDetectorSync,
  processDetectorSync,
} = require('@opentelemetry/resources');

const resource = detectResourcesSync({
  detectors: [
    envDetectorSync,
    hostDetectorSync,
    processDetectorSync,
  ],
});
Monitor your monitoring. OpenTelemetry itself can fail or misbehave. Configure the SDK to report its own metrics, monitor Collector health, and implement circuit breakers to prevent observability issues from impacting your application’s availability.
Protect sensitive data. Be cautious about what data you include in spans and logs. Use processors to filter PII, credentials, and other sensitive information before it leaves your environment. The attributes processor can redact or hash sensitive values.
Plan for cardinality. High-cardinality attributes in metrics (like user IDs or IP addresses) can cause significant storage and query performance issues. Use low-cardinality attributes for metrics and save high-cardinality data for traces and logs.
10. Integration with Popular Backends
OpenTelemetry’s vendor-neutral approach means you can send data to virtually any observability platform. Here’s how it integrates with popular options.
Jaeger is an open-source distributed tracing platform originally developed by Uber. It natively supports the OTLP protocol, making integration straightforward. Jaeger provides an excellent UI for exploring traces and understanding service dependencies.
Prometheus has become the de facto standard for metrics in cloud-native environments. The OpenTelemetry Collector can expose metrics in Prometheus format, allowing Prometheus to scrape them, or push metrics directly using the Prometheus Remote Write protocol.
Grafana ties everything together, providing visualization for both Prometheus metrics and Jaeger traces. Grafana Tempo and Loki provide native OpenTelemetry support for traces and logs respectively.
Commercial platforms like Datadog, New Relic, Dynatrace, and Honeycomb all support OTLP ingestion. You can send your OpenTelemetry data to these platforms without vendor-specific SDKs, reducing lock-in while gaining access to advanced analysis features.
Table 2: Popular Observability Backends for OpenTelemetry
| Backend | Type | OTLP Support | Best For | Cost Model |
|---|---|---|---|---|
| Jaeger | Open Source | Native | Distributed tracing, microservices | Free (self-hosted) |
| Prometheus | Open Source | Via Collector | Metrics, alerting, time-series | Free (self-hosted) |
| Grafana | Open Source / Commercial | Native (Tempo/Loki) | Visualization, dashboards | Free tier + paid plans |
| Datadog | Commercial SaaS | Native | Full-stack monitoring, APM | Per host + data volume |
| New Relic | Commercial SaaS | Native | APM, infrastructure monitoring | Per user + data ingestion |
| Honeycomb | Commercial SaaS | Native | Observability for complex systems | Data volume based |
| Elastic APM | Open Source / Commercial | Native | Logs, metrics, traces, search | Free + paid features |
| Lightstep | Commercial SaaS | Native | High-cardinality analysis | Custom enterprise pricing |
11. Troubleshooting Common Issues
Even with careful implementation, you’ll encounter challenges. Here are solutions to common problems.
Missing traces often result from context propagation failures. Verify that trace context headers are being properly injected and extracted across all service boundaries. Enable debug logging in the SDK to see what’s happening with context propagation:
const { diag, DiagConsoleLogger, DiagLogLevel } = require('@opentelemetry/api');

// Set diagnostic logging level
diag.setLogger(new DiagConsoleLogger(), DiagLogLevel.DEBUG);
High cardinality explosions occur when unique identifiers end up as metric attributes. Review your metric instrumentation and ensure you’re only using low-cardinality dimensions. Consider using traces for high-cardinality data instead.
Performance overhead can occur with aggressive instrumentation. Profile your application with and without instrumentation to understand the impact. Adjust sampling rates, reduce the number of custom spans, or use asynchronous exporting to minimize overhead.
Data loss might happen if the Collector becomes overwhelmed. Implement appropriate queue sizes and retry logic in the Collector configuration. Consider deploying multiple Collector instances behind a load balancer for high-volume scenarios.
12. Advanced Patterns and Techniques
Once you have basic observability in place, you can leverage more sophisticated patterns.
Exemplars link metrics to traces by embedding trace IDs in metric data points. When you see a spike in your latency histogram, exemplars let you click through to actual traces from that time period, providing concrete examples of the behavior you’re investigating.
Service mesh integration with technologies like Istio or Linkerd can provide automatic distributed tracing for all service-to-service communication without any application code changes. OpenTelemetry can complement this with application-level instrumentation for business logic.
Continuous profiling extends observability to include CPU and memory profiles. While not directly part of OpenTelemetry, profiles can be correlated with traces to understand performance bottlenecks at the code level.
Custom instrumentation for business metrics goes beyond technical metrics to track business KPIs. Instrument your code to emit metrics about orders processed, revenue generated, or features used. This bridges the gap between technical and business observability.
13. The Future of OpenTelemetry
OpenTelemetry continues to evolve rapidly. The project recently reached stable status for traces and metrics, with logging stabilization in progress. Profiling support is under active development, which will add continuous profiling as a fourth pillar of observability.
The ecosystem is expanding with more auto-instrumentation libraries, improved performance, and enhanced integration with cloud platforms. Major cloud providers now offer native OpenTelemetry support, making it easier than ever to adopt.
As the project matures, expect to see better tooling, more comprehensive documentation, and continued convergence around OpenTelemetry as the universal observability standard.
14. What We’ve Learned
Throughout this deep dive, we’ve covered the essential aspects of building observable systems with OpenTelemetry. Let’s recap the key takeaways.
We explored the three pillars of observability—distributed tracing, metrics, and logging—and how OpenTelemetry provides a unified framework for collecting all three. The vendor-neutral approach eliminates lock-in and simplifies the instrumentation process, allowing you to focus on what to observe rather than how to send it to a specific platform.
We walked through practical implementation details: initializing the SDK, using automatic instrumentation for common frameworks, creating custom spans for business logic, emitting metrics to track system behavior, and correlating logs with traces for effective debugging.
The OpenTelemetry Collector emerged as a crucial component, providing centralized configuration, data processing capabilities, and the flexibility to route telemetry to multiple backends simultaneously. Its architecture of receivers, processors, and exporters enables sophisticated pipelines tailored to your specific needs.
Context propagation across service boundaries proves critical for distributed tracing, and OpenTelemetry’s support for the W3C Trace Context standard ensures compatibility across the ecosystem. Combined with semantic conventions, this standardization brings consistency to your telemetry data.
Best practices for production deployments emphasize intelligent sampling, resource detection, sensitive data protection, and cardinality management. Monitoring your monitoring infrastructure and planning for failure modes ensures that observability doesn’t become a liability.
The integration ecosystem surrounding OpenTelemetry is rich and growing, with support from both open-source projects like Jaeger and Prometheus, and commercial platforms like Datadog and New Relic. This flexibility means you can start with open-source solutions and migrate to commercial platforms as your needs evolve, all without reinstrumenting your code.
Perhaps most importantly, we’ve learned that observability is not just about collecting data—it’s about making your systems understandable. OpenTelemetry provides the foundation, but the real value comes from thoughtful instrumentation that captures the right data at the right granularity. It’s about creating a feedback loop that helps you understand system behavior, diagnose issues quickly, and continuously improve performance and reliability.
As microservices and distributed systems become increasingly complex, observability isn’t optional—it’s foundational. OpenTelemetry has emerged as the standard because it solves real problems: vendor lock-in, inconsistent instrumentation, and the complexity of managing multiple observability tools. By adopting OpenTelemetry, you’re not just implementing monitoring; you’re building a culture of understanding how your systems actually behave in production.
The journey to full observability is iterative. Start with automatic instrumentation to get immediate value, then add custom instrumentation for your most critical paths. Build dashboards and alerts on top of your metrics, use traces to understand request flows, and correlate logs for deep debugging. Over time, observability becomes not just a tool for incident response, but a lens through which you understand and improve your entire system.
