Memory management remains one of Java’s most powerful yet misunderstood features. While garbage collection frees developers from manual memory allocation nightmares that plague C and C++ programmers, this abstraction creates a dangerous illusion—that memory “just works.” In reality, Java applications can leak memory, exhaust resources, and suffer catastrophic performance degradation when developers fail to understand the intricate dance between heap, stack, metaspace, and native memory.
The stakes are higher than ever. Modern applications handle massive datasets, support thousands of concurrent users, and operate under strict latency requirements. A poorly tuned garbage collector can introduce 500ms pauses that violate SLAs. Memory leaks that go undetected in development can crash production systems weeks later. Off-heap memory, invisible to traditional monitoring, can silently consume gigabytes until the operating system kills your process.
This deep dive explores the JVM’s memory architecture from first principles, examining how memory is allocated, managed, and reclaimed. We’ll investigate garbage collection mechanisms that have evolved over decades, learn to detect and prevent memory leaks before they reach production, venture into off-heap memory territories where garbage collection doesn’t reach, understand native memory considerations that affect total process footprint, and master tools that make invisible memory visible.
JVM Memory Architecture: Beyond the Heap
The JVM’s memory model divides into distinct regions, each with specific purposes and characteristics. Understanding this architecture is fundamental to diagnosing memory issues and optimizing performance.
The Java Heap receives the most attention because it houses all object instances. When you write new Customer(), the memory comes from the heap. A good rule of thumb is to size the heap so that it is 30% occupied after a full GC, balancing between too-frequent collections (small heap) and too-long pauses (large heap). The heap itself divides into generations based on object lifespans—Young Generation for newly created objects and Old Generation for long-lived survivors.
Young Generation further splits into Eden space and two Survivor spaces (S0 and S1). Most objects die young—they’re allocated, used briefly, and become garbage quickly. Eden holds new allocations until it fills, triggering a Minor GC that copies living objects to a Survivor space. Objects that survive multiple Minor GCs eventually promote to Old Generation. This generational hypothesis—that most objects die young—drives garbage collector design across all modern JVMs.
The Stack (technically, one per thread) stores local variables and method call frames. Each method invocation pushes a new frame containing its parameters and local variables. When the method returns, its frame pops off, automatically reclaiming that memory. Stack memory is LIFO (last-in, first-out), fast to allocate and deallocate, and never suffers fragmentation. Stack overflow errors occur when method call depth exceeds stack size, typically from infinite recursion or excessively deep call chains.
Metaspace (replacing PermGen in Java 8+) holds class metadata—information about classes themselves rather than class instances. When the JVM loads a class, it stores the class structure, method bytecode, constant pool, and field descriptors in Metaspace. Unlike PermGen’s fixed size, Metaspace can grow dynamically, limited only by available native memory. This flexibility prevents the dreaded OutOfMemoryError: PermGen space but introduces new risks—uncontrolled Metaspace growth from classloader leaks or dynamic class generation.
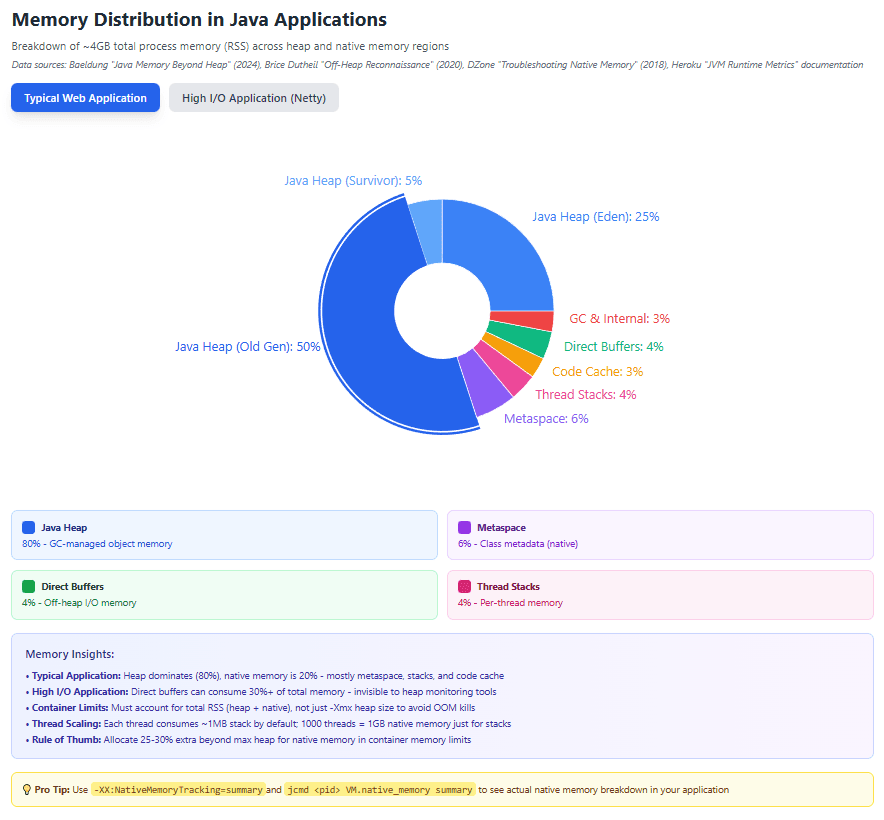
Native Memory encompasses everything outside the Java heap—thread stacks, direct buffers, native libraries, and JVM internals. Native Memory Tracking (NMT) provides visibility into these regions. The JVM reserves address space for various purposes: code cache for JIT-compiled methods, garbage collector data structures, symbols, and internal buffers. Understanding native memory is crucial because total process memory (RSS – Resident Set Size) equals heap plus native memory, and containerized environments with memory limits kill processes that exceed their allocation regardless of heap size.
Garbage Collection Mechanisms: Automation with Trade-offs
Garbage collection eliminates manual memory management but introduces latency through stop-the-world pauses where application threads halt while the GC does its work. Different collectors make different trade-offs between throughput, pause times, and memory footprint.
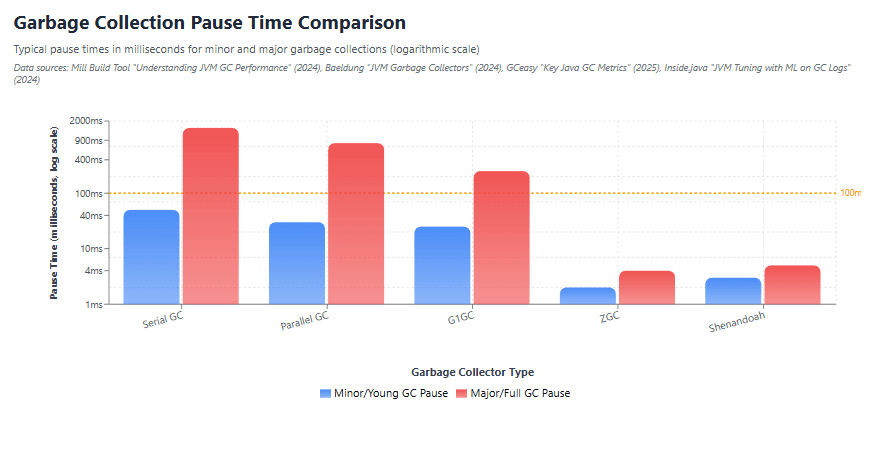
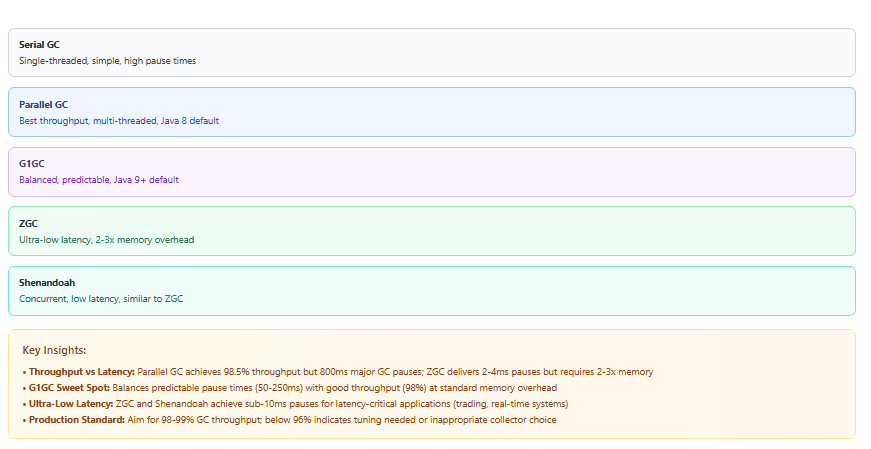
Serial GC uses a single thread for both minor and major collections. It’s simple, predictable, and suitable for small applications on single-processor systems or client applications where pause times don’t matter. The Serial GC is the garbage collector of choice for most applications that don’t have small pause time requirements and run on client-style machines. In server environments, Serial GC is rarely appropriate—its single-threaded nature wastes modern multi-core processors.
Parallel GC (also called Throughput Collector) applies multiple threads to garbage collection, dramatically reducing pause times on multi-core systems. It’s the default in Java 8 and optimizes for application throughput—minimizing time spent in GC relative to application execution. If an application’s GC throughput is 98%, it means the application spends 98% of its time processing customer transactions and 2% of its time in processing GC activities. Organizations should aim for 98-99% GC throughput in production systems.
G1GC (Garbage-First) became Java 9’s default, designed for large heaps (4GB+) with predictable pause time goals. G1 divides the heap into regions rather than fixed generations, allowing it to collect the regions with the most garbage first (hence “Garbage-First”). After the mark phase is complete, G1 knows which regions are mostly empty. It collects in these areas first, which usually yields a significant amount of free space. G1 targets specific pause time goals (configurable via -XX:MaxGCPauseMillis) and works incrementally, collecting portions of the heap rather than the entire heap at once.
ZGC represents a quantum leap in low-latency garbage collection. ZGC can bring pause times down from 50-500ms down to 1-5ms, but requires significant additional memory—often 2x the heap size. ZGC achieves this through concurrent processing—most GC work happens while application threads run—and colored pointers that track object states without stopping threads. For latency-sensitive applications where every millisecond matters—financial trading systems, real-time gaming backends, high-frequency API services—ZGC’s sub-millisecond pauses justify the memory overhead.
Shenandoah GC, similar to ZGC in philosophy, also targets ultra-low pause times through concurrent evacuation. Both ZGC and Shenandoah use load barriers (small bits of code executed on every object access) to maintain consistency while moving objects concurrently with application execution. The trade-off is throughput—these collectors typically achieve 10-20% less throughput than G1 due to barrier overhead, but for latency-critical applications, this is acceptable.
Choosing the right garbage collector requires understanding your application’s priorities. If throughput matters most and you can tolerate 100-500ms pauses, use Parallel GC. For balanced performance with large heaps and moderate pause time goals, G1GC excels. When ultra-low latency is paramount and you have memory to spare, deploy ZGC or Shenandoah. The decision isn’t permanent—modern JVMs support runtime GC switching through JVM parameters without code changes.
Memory Leaks: Detection and Prevention
Memory leaks in Java don’t mean failing to call free() like in C. Instead, they occur when objects that should be garbage are unintentionally retained through lingering references. The garbage collector works perfectly—it can’t collect what appears to be in use. Java memory leaks are caused when objects that are unreferenced get categorized as referenced. This stops the garbage collector from clearing the memory.
Classic leak patterns include static collections that grow indefinitely, listener registrations without corresponding de-registrations, ThreadLocal variables never removed, and caches without eviction policies. Consider a web application that registers session listeners but never unregisters them—each session remains in memory indefinitely, even after the user logs out. Over days or weeks, memory gradually fills until the application crashes.
According to a 2024 study, 30% of complex Java applications experienced prolonged downtime attributed to memory-related failures. Early detection prevents production disasters. Symptoms include steadily increasing heap usage over time, frequent full garbage collections that don’t reclaim significant memory, and eventual OutOfMemoryError: Java heap space after running for extended periods.
Heap dumps provide snapshots of all objects in memory. Tools like jmap generate heap dumps from running processes or automatically on OOM errors via -XX:+HeapDumpOnOutOfMemoryError. Approximately 70% of memory issues stem from improper object retention, and Eclipse MAT can effectively pinpoint the offenders.
Eclipse Memory Analyzer (MAT) excels at heap dump analysis. Its “Leak Suspects Report” identifies objects likely causing leaks by analyzing retention chains—the paths of references keeping objects alive. MAT calculates retained size (memory an object holds plus everything it references) and shallow size (memory the object itself occupies). Large retained sizes indicate memory bottlenecks.
Prevention strategies involve coding discipline. Explicitly remove listeners and callbacks when they’re no longer needed. Use weak references for caches so objects can be collected when memory pressure rises. Implement finite caches with LRU eviction policies. Clear ThreadLocal variables in finally blocks. Never store collections in static fields without size limits. These patterns prevent leaks before they manifest.
Off-Heap Memory: Beyond Garbage Collection’s Reach
The Java heap isn’t the only memory Java applications use. Off-heap (native) memory, allocated outside garbage collection’s domain, offers performance benefits but introduces management complexity.
DirectByteBuffers are the primary off-heap mechanism in pure Java applications. When such an object is created, it makes an internal call that allocates the amount of native memory equal to the buffer capacity. Direct buffers eliminate copying between Java heap and native memory during I/O operations—you can pass them directly to operating system calls. Libraries like Netty heavily use direct buffers for network I/O efficiency.
However, direct buffers create a peculiar memory management challenge. The Java NIO API caches a maximum-sized direct ByteBuffer for each thread, which looks like a native memory leak if you read or write large blocks from many threads. This per-thread caching can consume gigabytes of native memory invisible to heap monitoring. Symptoms include RSS (resident set size) far exceeding heap size, and mysterious OutOfMemoryError: Direct buffer memory despite heap space availability.
The -XX:MaxDirectMemorySize parameter limits direct buffer allocation. Without it, direct buffers can consume all available native memory. Set this parameter based on your application’s I/O patterns—if you use many large direct buffers, increase the limit; if you rarely use them, constrain them to prevent runaway native memory consumption.
Memory-mapped files (via FileChannel.map()) also consume off-heap memory. Memory-mapping maps file contents directly into virtual address space, allowing file access as if it were memory. This is exceptionally fast for large files but each mapped file consumes address space. On 32-bit systems with limited address space, excessive memory-mapping can exhaust virtual memory even when physical memory is available.
Native Memory Considerations: The Complete Picture
Understanding total memory consumption requires looking beyond the heap. Native memory includes thread stacks, metaspace, code cache, garbage collector structures, symbols, JNI allocations, and more. In containerized environments with memory limits, this complete picture is critical—the container doesn’t distinguish between heap and native memory.
Native Memory Tracking (NMT), enabled via -XX:NativeMemoryTracking=summary, provides visibility into JVM’s internal memory usage. The jcmd tool queries NMT: jcmd <pid> VM.native_memory summary. This reports memory by category—Java Heap, Class (metaspace), Thread, Code, GC, Compiler, Symbol, and Other.
Committed stands for writable memory and reserved stands for total addressable space of the memory. Reserved memory is address space the JVM has claimed but not necessarily backed by physical memory. Committed memory is actually allocated and usable. The difference between RSS and committed heap memory reveals native memory consumption.
Thread stacks contribute significantly to native memory. Each thread receives its own stack, sized via -Xss (default ~1MB on 64-bit systems). A hundred threads consume 100MB just for stacks before any application code runs. Thread pooling and careful thread management prevent stack memory from dominating.
Metaspace, while native memory, differs from other native regions because it’s managed by the JVM and can be limited via -XX:MaxMetaspaceSize. Metaspace typically stabilizes after all classes load, but applications using dynamic class generation (proxies, scripting engines, bytecode manipulation) can exhibit growing Metaspace. Metaspace leaks often stem from classloader leaks—classes can’t be unloaded until their defining classloader becomes collectible.
The Code Cache stores native code from JIT compilation. The -XX:ReservedCodeCacheSize parameter sets its maximum size (default 240MB in recent JVMs). Applications with enormous codebases or aggressive JIT compilation can fill the code cache, preventing further compilation and potentially degrading performance. Monitoring code cache usage prevents this subtle performance degradation.
Tools for Memory Analysis: Making the Invisible Visible
Effective memory management requires visibility. Various tools provide different perspectives on memory usage, from high-level trends to detailed object graphs.
VisualVM, bundled with the JDK, provides real-time heap monitoring, garbage collection statistics, thread analysis, and CPU profiling. VisualVM is recommended for its convenience and effectiveness in basic Java troubleshooting, especially useful for initial problem identification. Its heap dump capture and basic analysis capabilities make it ideal for first-line investigation. VisualVM connects to local or remote JVMs via JMX, displaying heap usage trends, GC activity, and loaded classes.
JProfiler offers commercial-grade profiling with sophisticated memory leak detection. It tracks object allocation, identifies hot spots, analyzes heap dumps, and monitors off-heap memory. 65% of users preferred JProfiler for its ease of use and quick integration. JProfiler’s live heap analysis watches memory grow in real-time, highlighting allocation hot spots and object retention causes. Its integration with IDEs streamlines the development-to-profiling workflow.
Eclipse MAT, specialized for heap dump analysis, processes dumps with hundreds of millions of objects efficiently. Beyond leak suspects reports, MAT provides dominator trees (showing what keeps objects alive), object query language (SQL-like queries on object graphs), and retention analysis. MAT’s shallow heap vs. retained heap distinction clarifies which objects actually hold memory versus which merely reference it.
GCeasy and GCViewer parse and visualize garbage collection logs. Garbage collector logs provide information that’s not available in other sources, like stop the world events and how long they took, how long the application threads were stopped, memory pool utilization. GC logs, enabled via -Xlog:gc*:file=gc.log (Java 9+), record every garbage collection event with timestamps, pause durations, heap sizes before and after, and promotion rates. Analyzing these logs reveals patterns—frequent young gen collections suggest high allocation rates, long old gen pauses indicate heap tuning issues, and promotion failures signal generational sizing problems.
Java Flight Recorder (JFR) provides production-grade profiling with minimal overhead (typically 1-2%). JFR continuously records events—GC, JIT compilation, thread synchronization, I/O, exceptions—that can be analyzed post-mortem. Unlike profilers that impact performance significantly, JFR runs in production safely. Since Java 20, JFR records Native Memory Tracking data, enabling continuous monitoring of native memory without NMT’s 5-10% overhead.
jstat displays real-time garbage collection and memory statistics without the overhead of full profiling. jstat -gc <pid> 1000 reports GC statistics every second—eden, survivor, and old generation sizes and usage, GC counts and times. This lightweight monitoring suits production environments where installing profilers isn’t feasible.
For containerized applications, tools like Kubernetes metrics-server and Prometheus with Java exporters provide cluster-wide memory visibility. Container memory limits must account for total JVM memory (heap + native), not just heap size. A container with 4GB limit running a JVM with 3.5GB heap will OOM-kill when native memory pushes RSS above 4GB.
Best Practices for Memory-Efficient Code
Writing memory-efficient Java code requires understanding how objects are allocated, lived, and collected.
Right-size your heap. Too small causes excessive GC, too large delays collections and increases pause times. Start with -Xms equal to -Xmx (minimum and maximum heap) to prevent heap resizing overhead. Monitor heap usage after full GC—if consistently above 70%, increase heap size; if below 30%, decrease it. Use generational sizing flags (-XX:NewRatio, -XX:SurvivorRatio) to balance young and old generations based on application object lifetimes.
Minimize object allocation. While GC is cheap for short-lived objects, unnecessary allocations waste memory bandwidth and trigger collections. Reuse objects when appropriate—StringBuilder instead of string concatenation, object pools for expensive-to-create objects, primitive arrays instead of boxed collections. However, don’t over-optimize—modern escape analysis and scalar replacement eliminate many allocations automatically.
Use appropriate data structures. ArrayList vs. LinkedList isn’t just about algorithmic complexity—ArrayList’s contiguous memory is cache-friendly while LinkedList’s node overhead (24 bytes per node) can double memory usage. HashMap with proper initial capacity prevents resizing and rehashing. Consider specialized collections from libraries like Trove or Fastutil that use primitive types instead of boxed objects.
Avoid premature optimization, but measure everything. Use profilers during development to identify actual hotspots rather than optimizing hypothetical problems. Memory leaks and inefficiencies manifest under load—load test with production-like data volumes and concurrency. Monitor memory trends over hours and days, not just minutes.
Tune garbage collection for your workload. Set explicit pause time goals (-XX:MaxGCPauseMillis=200) for latency-sensitive applications. Configure concurrent GC threads based on CPU cores. Enable GC logging in production (the overhead is negligible) to diagnose issues when they arise. Consider region sizing for G1GC (-XX:G1HeapRegionSize) based on object size distribution.
Implement graceful degradation. When memory pressure rises, shed load rather than crash. Implement circuit breakers that reject requests when heap usage exceeds thresholds. Cache eviction policies based on memory pressure, not just LRU. Expose memory metrics through health checks so orchestrators can scale or restart instances preemptively.
What We’ve Seen: Mastering Memory in Modern Java
Java’s memory management, while automatic, demands understanding for production-grade applications. The JVM’s multi-region architecture—heap, stack, metaspace, native memory—each serves specific purposes with distinct characteristics. Garbage collection, through collectors ranging from simple Serial GC to sophisticated ZGC, automates reclamation but introduces latency trade-offs that require tuning.
Memory leaks, despite garbage collection, remain a persistent challenge. 30% of complex Java applications experienced prolonged downtime attributed to memory-related failures, emphasizing the importance of leak detection tools and prevention strategies. Understanding retention chains, using heap dump analyzers like Eclipse MAT, and implementing defensive coding patterns prevent leaks from reaching production.
Off-heap memory, particularly DirectByteBuffers, offers performance benefits for I/O-intensive applications but introduces management complexity invisible to traditional heap monitoring. Native memory considerations extend beyond the heap to encompass thread stacks, metaspace, code cache, and JVM internals. Container environments demand accounting for total memory consumption, not just heap size.
The tooling ecosystem provides visibility at every level—VisualVM for real-time monitoring, JProfiler for detailed allocation analysis, Eclipse MAT for heap dump investigation, GC log analyzers for collection pattern insights, and Java Flight Recorder for production-safe continuous profiling. Each tool addresses different aspects of memory analysis, and mastering multiple tools enables comprehensive memory understanding.
Performance optimization research continues to advance. Machine learning models trained on GC log data can suggest optimal JVM flag values, particularly memory-related flags, to improve application performance. The future of memory management lies in automated tuning, predictive analytics for leak detection, and increasingly sophisticated garbage collectors that adapt to workload characteristics without manual configuration.
Memory-efficient code isn’t about avoiding garbage collection—it’s about working with GC effectively. Right-size heaps based on actual usage patterns. Choose appropriate data structures that balance algorithmic complexity with memory overhead. Minimize unnecessary allocations without premature optimization. Monitor continuously and tune based on measured behavior rather than assumptions.
The JVM has evolved tremendously since Java’s inception, with garbage collectors becoming faster, more concurrent, and more predictable. ZGC and Shenandoah deliver sub-millisecond pauses that seemed impossible a decade ago. Native Memory Tracking and Flight Recorder make previously invisible memory visible. Container-aware JVM defaults adapt to modern deployment patterns automatically.
Yet fundamentally, memory management requires developers who understand the principles. Automatic memory management doesn’t mean absent memory management—it means the JVM handles allocation and deallocation while developers handle design decisions that determine whether memory is used efficiently or squandered wastefully.
Master the heap, understand the stack, account for native memory, tune garbage collection, detect leaks early, and leverage the rich tooling ecosystem. These practices separate Java applications that scale gracefully from those that crash mysteriously under load. In production, where downtime costs money and reputation, memory management expertise isn’t optional—it’s essential.
