
I Want to Build a Business Tool with ChatGPT - But I Have No Knowledge of Source Code -

I want to build a business tool myself
What are you doing every day?
Hello. It's getting warmer, and it really feels like "spring" now.
In Japanese, the kanji for "spring" (春) is written with "insect" (虫) underneath to form the word "ugomeku" (to wriggle), and the insects outside have become active too.
However, "moths"! You are not welcome.
The other day, a huge moth got into the house, and my family was screaming in chaos while swinging a butterfly net around. Don't ever come back, you pest.
Now, I've been busy fluttering around like a moth drawn to a light, but when a boss or someone asks, "What are you doing that keeps you so busy every day?" doesn't that just make you snap?
It's Breaking Down time!!
But then, wait? What was I busy doing again? That happens too.
In the end,"No, I'm just busy doing all sorts of things!!"Have you ever had the experience of blurting out something stupid like that?
Well,they say "You should never look back on 'past romances' or 'when you are shampooing'"(though nobody actually says that).
On the contrary, a capable business person knows thatreflecting on "what exactly they spent their time on and how much"is important.
So!
"I want to build a tool that lets me know what I spent my time on and how much"
It's the "I want to build it series" again, undeterred.
By the way, my specs are that I've been in IT sales for 10 years, but my knowledge of source code is basically zero gravity.
Back in the day, it took me a whole day just to display "Hello World".
A combat power of only 5, you trash.
But now, I have ChatGPT-sama.
It has granted most of my wishes so far.
Can a hopeless guy with no knowledge of syntax or anything actually build the tool he wants? Well, let's just give it a try.
Conveying the overview
First, regarding the overview of this tool,
I want buttons for each category like "Recruitment Activities," "Sales Activities," "Administrative Work," and "Other," andwhen you press a button, it measures the time for each item,
and when you press something like a "Confirm" button, it displays a pie chart of theproportions of time spent on each item measured so far,so that you can see at a glance what you did for the day. That's the kind of tool I'm aiming for.
That said, I'm at the level where I'm rolling my eyes and saying "Hello World!", so if someone tells me to set up a server or a database, it's honestly tough.
I feel like I might be able to manage something simple that runs in a browser.
First, let's throw the overview at ChatGPT.
I want to build a web app
Overview
Create buttons for each category: "Recruitment Activities," "Sales Activities," "Administrative Work," and "Other"
When a button is pressed, measure the time for each item
Accumulate the time for each item, and when the "Confirm" button is pressed, display a pie chart of the time spent on each item measured so far
Provide the source code
That's exactly what I said. There's no prompt or anything to it.
Even so, ChatGPT spat out the HTML, CSS, and Javascript code for me.
ChatGPT response ↓
Yes, I can provide an example of source code focused on basic functionality. Here is the basic code using simple HTML, CSS, and JavaScript to generate time-tracking buttons and a pie chart to display the time data.
HTML
<!DOCTYPE html>
<html lang="ja">
<head>
    <meta charset="UTF-8">
    <title>時間追跡アプリ</title>
    <link rel="stylesheet" href="style.css">
</head>
<body>
    <div id="buttons">
        <button onclick="startTimer('採用活動')">採用活動</button>
        <button onclick="startTimer('営業活動')">営業活動</button>
        <button onclick="startTimer('事務作業')">事務作業</button>
        <button onclick="startTimer('その他')">その他</button>
    </div>
    <button onclick="showResults()">決定</button>
    <div id="chart"></div>

    <script src="/https://cdn.jsdelivr.net/npm/chart.js"></script>
    <script src="script.js"></script>
</body>
</html>
CSS
#buttons button {
    margin: 5px;
}
JavaScript
const timeSpent = {
    '採用活動': 0,
    '営業活動': 0,
    '事務作業': 0,
    'その他': 0
};

let timer = null;
let currentActivity = null;

function startTimer(activity) {
    if (timer) {
        clearInterval(timer);
    }
    currentActivity = activity;
    timer = setInterval(() => {
        timeSpent[currentActivity]++;
        console.log(`${currentActivity}: ${timeSpent[currentActivity]}秒`);
    }, 1000);
}

function showResults() {
    if (timer) {
        clearInterval(timer);
        timer = null;
    }
    const ctx = document.getElementById('chart').getContext('2d');
    new Chart(ctx, {
        type: 'pie',
        data: {
            labels: Object.keys(timeSpent),
            datasets: [{
                data: Object.values(timeSpent),
                backgroundColor: ['red', 'blue', 'green', 'yellow']
            }]
        }
    });
}
I have no idea what is written here, but something came out.
Execute the code
Someone somewhere said that if you paste this into a text editor and run it, it should work.
Like this, separating it into each file...

index.htmlDouble-click it!!
Then...

A button has appeared on the web page.
And if I press this "Confirm" button, a pie chart should appear.
...Click.
Silence...
There is no response; it's like a mere corpse.
Fighting the error
For now, I believe if you press "Ctrl+Shift+I" in Chrome, the developer tools will appear.
Developer tools are verification tools for developers that come standard with Google Chrome.
You should be able to see where the error is occurring.
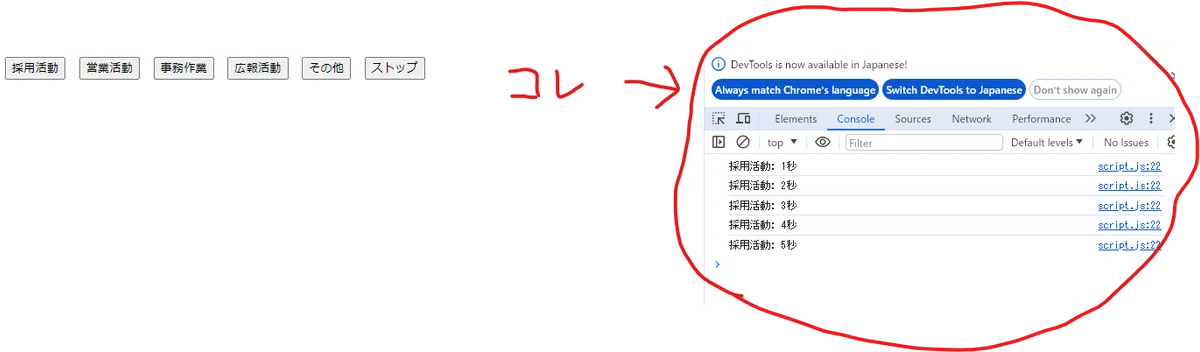
Looking at it, it seems like the time count is progressing, but it looks like some kind of error is happening at the confirm button.
I don't know what the error is, so I'll just copy and paste the text and ask ChatGPT.
Uncaught TypeError: document.getElementById(...).getContext is not a function at showResults (script.js:27:50) at HTMLButtonElement.onclick (index.html:15:37)
This message appeared. What should I do?
ChatGPT response↓
This error message "Uncaught TypeError: document.getElementById(...).getContext is not a function" indicates that when you tried to call the getContext() function on the element retrieved by document.getElementById(), that element did not have the getContext function (in other words, it is not a canvas element).
" Not a Canvas element "!!!
...What on earth are you talking about?
ChatGPT response continued↓
Add a canvas element to the HTML:
getContext() function is used with the canvas element. To display a pie chart, you need a canvas element. Open the
index.html file and add the canvas element as follows:
<canvas id="chart"></canvas>I see, I don't really get it, but this seems to define the area for drawing the graph.
I guess since this was missing, Javascript lost track of that area.I don't know, though.
Well then, let's add this to the HTML immediately.
If I try it with this...

It's like a "sunrise" now.
By the way, it seems that in cases like this, you just need to fix it like this.
<canvas id="chart" width="300" height="300"></canvas>I see, that's simple.
So it happened because I didn't specify the size.
Let's fix it.

Even if I zoom in or out with Ctrl, only this guy's size doesn't change. Huh...
And so began the long battle to change the size of the pie chartbut I finally got a decent answer.
ChatGPT response↓
If you are using Chart.js, it is possible that the graph is responsive and set to automatically change size according to the size of its parent element as well. By disabling the responsive setting, you can fix it to a directly specified size. For example, when creating a Chart.js graph, you can set responsive: false in the options:
Ah, I see, so that's how it is.
Because of the responsive setting, the graph is looking at the size of the place where it's placed and making itself bigger or smaller.
And if you disable that setting with responsive: false.
responsive: false I'll add it and try again.
myChart = new Chart(ctx, {
    type: 'pie',
    data: {
        labels: Object.keys(timeSpent),
        datasets: [{
            data: Object.values(timeSpent),
            backgroundColor: ['red', 'blue', 'green', 'yellow']
        }]
    },
    options: {
        responsive: false
    }
});
How's this!

Make minor adjustments
I did it! It took so long!
It took me two hours just to get to this point. I have no sense for this~
For now, once I've reached this point, I've pretty much done what I wanted to do.
However, I want to make it look a little better.
Let's have it tweak the CSS a bit and make some nice-looking buttons.
I want to make the buttons look a bit cooler
ChatGPT response↓
button {
    background-color: #3498db; /* 青色の背景 */
    color: white; /* 白色のテキスト */
    padding: 10px 20px; /* パディングを適用 */
    margin: 5px; /* 外側の余白 */
    border: none; /* 枠線なし */
    border-radius: 5px; /* 角を丸くする */
    font-size: 16px; /* フォントサイズ */
    font-weight: bold; /* フォントを太字に */
    cursor: pointer; /* カーソルをポインターに */
    transition: background-color 0.3s, transform 0.2s; /* 背景色と変形のトランジションを設定 */
}

button:hover {
    background-color: #2980b9; /* ホバー時の背景色を少し暗く */
    transform: scale(1.05); /* ボタンを少し大きくする */
}

button:active {
    background-color: #1a5276; /* クリック時の背景色をさらに暗く */
    transform: scale(0.95); /* ボタンを少し小さくする */
}
Also, when you press the button, time passes, but there was no way to stop it.
I'll add a stop button too.
I want to add a stop button to pause the passage of time
ChatGPT response↓
<button onclick="stopTimer()">ストップ</button>function stopTimer() {
if (timer) {
clearInterval(timer);
timer = null;
console.log("タイマーを停止しました。");
}
}I added button types and
in the end, it looked like this.

Complete
① Pressing the button advances the time for that item
② If you want to stop the time, press the stop button

③ Pressing the finish button displays a pie chart of the percentage of time spent on each
④ Hovering the cursor over the pie chart shows the total time (in seconds)

By the way, the code ends up looking like this.
HTML
<!DOCTYPE html>
<html lang="ja">
<head>
<meta charset="UTF-8">
<title>時間追跡アプリ</title>
<link rel="stylesheet" href="style.css">
</head>
<body>
<div id="buttons">
<button onclick="startTimer('採用活動')">採用活動</button>
<button onclick="startTimer('オファーメール')">オファーメール</button>
<button onclick="startTimer('営業活動')">営業活動</button>
<button onclick="startTimer('資料作成')">資料作成</button>
<button onclick="startTimer('事務作業')">事務作業</button>
<button onclick="startTimer('広報活動')">広報活動</button>
<button onclick="startTimer('その他')">その他</button>
<button onclick="stopTimer()">ストップ</button>
</div>
<button onclick="showResults()">決定</button>
<canvas id="chart" width="300" height="300"></canvas>
<script src="/https://cdn.jsdelivr.net/npm/chart.js"></script>
<script src="script.js"></script>
</body>
</html>
CSS
#buttons button {
margin: 5px;
}
button {
background-color: #3498db; /* 青色の背景 */
color: white; /* 白色のテキスト */
padding: 10px 20px; /* パディングを適用 */
margin: 5px; /* 外側の余白 */
border: none; /* 枠線なし */
border-radius: 5px; /* 角を丸くする */
font-size: 16px; /* フォントサイズ */
font-weight: bold; /* フォントを太字に */
cursor: pointer; /* カーソルをポインターに */
transition: background-color 0.3s, transform 0.2s; /* 背景色と変形のトランジションを設定 */
}
button:hover {
background-color: #2980b9; /* ホバー時の背景色を少し暗く */
transform: scale(1.05); /* ボタンを少し大きくする */
}
button:active {
background-color: #1a5276; /* クリック時の背景色をさらに暗く */
transform: scale(0.95); /* ボタンを少し小さくする */
}
Javascript
// グローバル変数としてmyChartを定義
let myChart = null;
const timeSpent = {
'採用活動': 0,
'営業活動': 0,
'事務作業': 0,
'その他': 0,
'オファーメール': 0,
'広報活動': 0,
'資料作成': 0
};
let timer = null;
let currentActivity = null;
function startTimer(activity) {
if (timer) {
clearInterval(timer);
}
currentActivity = activity;
timer = setInterval(() => {
timeSpent[currentActivity]++;
console.log(`${currentActivity}: ${timeSpent[currentActivity]}秒`);
}, 1000);
}
function stopTimer() {
if (timer) {
clearInterval(timer);
timer = null;
console.log("タイマーを停止しました。");
}
}
function showResults() {
if (timer) {
clearInterval(timer);
timer = null;
}
// 既存のグラフがあれば破棄する
if (myChart) {
myChart.destroy();
}
const ctx = document.getElementById('chart').getContext('2d');
myChart = new Chart(ctx, {
type: 'pie',
data: {
labels: Object.keys(timeSpent),
datasets: [{
data: Object.values(timeSpent),
backgroundColor: ['red', 'blue', 'green', 'yellow', 'pink', 'purple', 'orange']
}]
},
options: {
responsive: false
}
});
}Anyone can use it if you copy and paste it.
I cannot guarantee it will be useful, though.
Summary
AI is just an assistant
I set out to see if someone who knows nothing could use the power of AI to build something actually useful, and the conclusion is!
It's a bit iffy...
It might be just right for assisting someone who already has knowledge.
However, because I had ChatGPT, I was able to build it in one day.
If I were told to build it from scratch, I am confident it would take me several weeks even for something of this level.
In actual development, couldn't you also significantly compress time with AI assistance?
For example, you could have AI implement something functional somewhere between a mock and a prototype. It might be effective for bridging the gap in understanding between users and developers.
The importance of basics
I'm going to say something very obvious, but you reallycan't do it without knowing the basics. Those who are seriously aiming to become programmers should absolutely not do what I did.
If you don't know the basics,you can't narrow down the mistakes,so you end up spending hours identifying where the errors are.
Actually, I switched to "VS code" halfway through, andit shows you typos and error locations immediately. Tell me that sooner! (You should have known!)
Including things like that,going through basic learning before moving on to applicationsis probably the fastest way, even if it seems like a detour.
I hear that it's common for people who are self-taught to have messy code on the back end, even if it looks good on the surface.
But actually trying to run things and going through trial and error when things don't work is alsopart of the real thrill of making things, though.
So, my reflection for this time.
“I will properly buy a book”
See you again!!