
HR Data Analysis with ChatGPT (How Much Can We Delegate?)

I tried testing how useful ChatGPT is for HR data analysis, and I was so surprised by how well it performed that I wanted to share it with you.
You can perform interactive data analysis using the Advanced Data Analysis plugin in ChatGPT.The idea is that you simply tell ChatGPT what you want to analyze in plain language, and it handles the analysis for you. What an amazing world we live in.
This plugin was originally called Code Interpreter, and it caused quite a stir when it was first released. In this article, I've used an HR data analysis example I previously wrote about on note to see how ChatGPT would handle a similar task. It might be interesting to compare it with my own analysis example.
In conclusion, I got the impression that ChatGPT is quite useful for data exploration purposes. It performs analysis more accurately than someone unfamiliar with data analysis would, and it even resolves errors in the code.
However, whether it's giving instructions for analysis or checking the results, I also learned thatit is difficult to ask for things beyond the user's own experience. Also, one should be aware that caution is required from the perspective of data security.
Please take a look at the following process of analyzing while interacting with ChatGPT.
HR Data Analysis Topic
This involves using HR data (toy data) that I created to perform trend analysis. Specifically, using HR data that includes employee engagement survey results, I assumed a task toroughly grasp the current state and issues of engagement within the organization. This analysis example was covered in a previous note article.
The data used for this analysis can be downloaded from the link below.

Now, the characteristics of this data are that I created it by hand while thinking about various things, so it is designed to be somewhat vague even if analyzed roughly. Sensibly speaking, I have included mechanisms whereyou cannot really understand the relationships between data columns just by visualizing them or looking at correlation coefficients. Also, because it was created manually, the data is not that clean. On the other hand, there are no missing values or outliers. I am looking forward to seeing how ChatGPT handles this.
What is Advanced Data Analysis?
Let me reintroduce the Advanced Data Analysis used this time.
Advanced Data Analysis is one of the plugins for ChatGPT that enables interactive data analysis. It is a service that truly makes you think it is AI, as it performs analysis quickly when you ask for it in a chat. To use this plugin, you need ChatGPT Pro. If you have it enabled in your ChatGPT settings, you will be able to select it as shown below.

After starting a chat, you can upload the data you want to analyze and provide specific analysis requests, and it will perform the analysis somewhat automatically.
As a point of caution, it should be noted thatyou need to be careful about the security of the uploaded data. Even with the Pro plan, uploaded data may be used for service training, so it is better to refrain from uploading personal or confidential information. If using it for practical business purposes, you should consider services that run locally or the Enterprise version of ChatGPT from the perspective of data protection.
Analysis Request Content for ChatGPT
When I uploaded HR_Toy_Data_Personnel_Information.csv, ChatGPT checked the data items and asked about the analysis content.

So, I input the following analysis content into the prompt. For the "background leading to the analysis" and "data overview," I copied and pasted the content from theoriginal note article. The goal of the analysis was primarily to grasp the current situation, and it was intended to include visualization and correlation analysis. (Partially abbreviated)
# Overview of the Analysis Theme
You are a data analyst in the HR department. In this analysis, you have been assigned to conduct a survey on employee engagement. The purpose of the analysis is to understand the current state of employee engagement and identify issues. Specifically, please find attributes or clusters where engagement is relatively low across the company.
# Background of the Analysis
The reasons why this survey became necessary for the above analysis are described below.
- Increasing engagement is a key HR initiative.
- Engagement is measured through employee surveys, and it was decided to conduct the investigation using the latest (2021) survey results.
(Omitted)
# Analysis Approach
To grasp the current situation, please organize the findings using easy-to-understand expressions, focusing on data visualization with graphs and regression analysis.
# Data Overview
## HR_Toy_Data_Personnel_Information.csv This is the central data for this analysis. It includes basic personnel information and engagement data. The details of each item are described below.
Employee ID: An ID that uniquely identifies an employee. (Categorical variable)
Fiscal Year: The fiscal year in which the data was recorded. Other information is as of the end of the fiscal year. The fiscal year starts in April and ends in March. The same applies to the accounting year.
(Omitted)
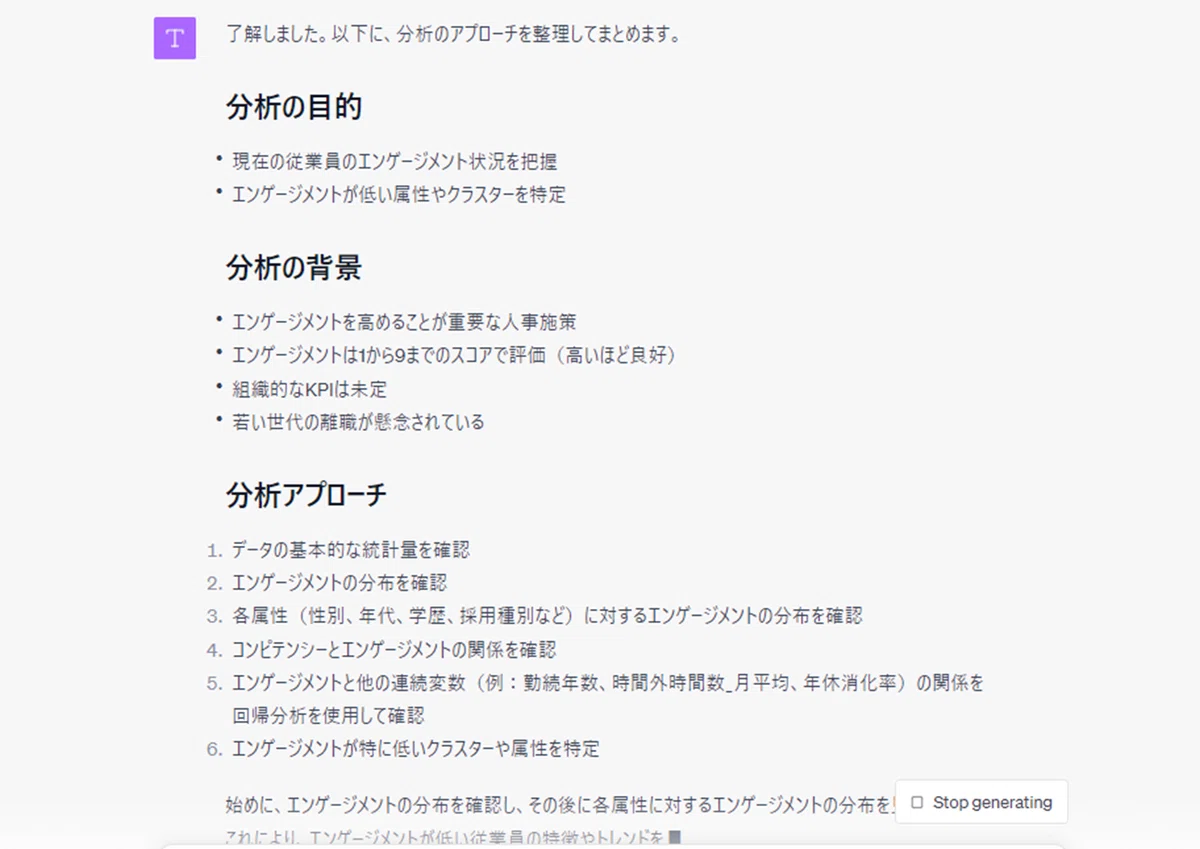
In response to this, ChatGPT summarized the approach as follows before starting the analysis. It is excellent in terms of preventing communication errors. If you think something is wrong here, you can stop the chat and give instructions again.
Start of analysis (occurrence and handling of the tofu problem)
It seems to have started by checking the distribution of engagement, which is the purpose of this analysis. It's not a bad first move. It seems to behave randomly; when I ran it for the first time, it used a histogram, but this time it seems to be a bar chart.

However, as you can see, the Japanese display is broken. This is the so-called tofu problem. This is a phenomenon that occurs when Japanese fonts are not set correctly in the Python environment. (Previous article)
Since I couldn't understand the analysis results like this, I stopped the chat and requested a fix.

It seems it couldn't solve it directly, but it changed the labels to English and proceeded with the analysis. I was genuinely impressed by this avoidance capability.
Asking to change the graph
The analysis resumed, and ChatGPT analyzed the relationship between engagement and other variables through visualization. However, since the distribution could not be seen by comparing averages with bar charts with error bars, I asked it to change to a box plot. It responded to my request without getting upset by the sudden interruption. Much appreciated.
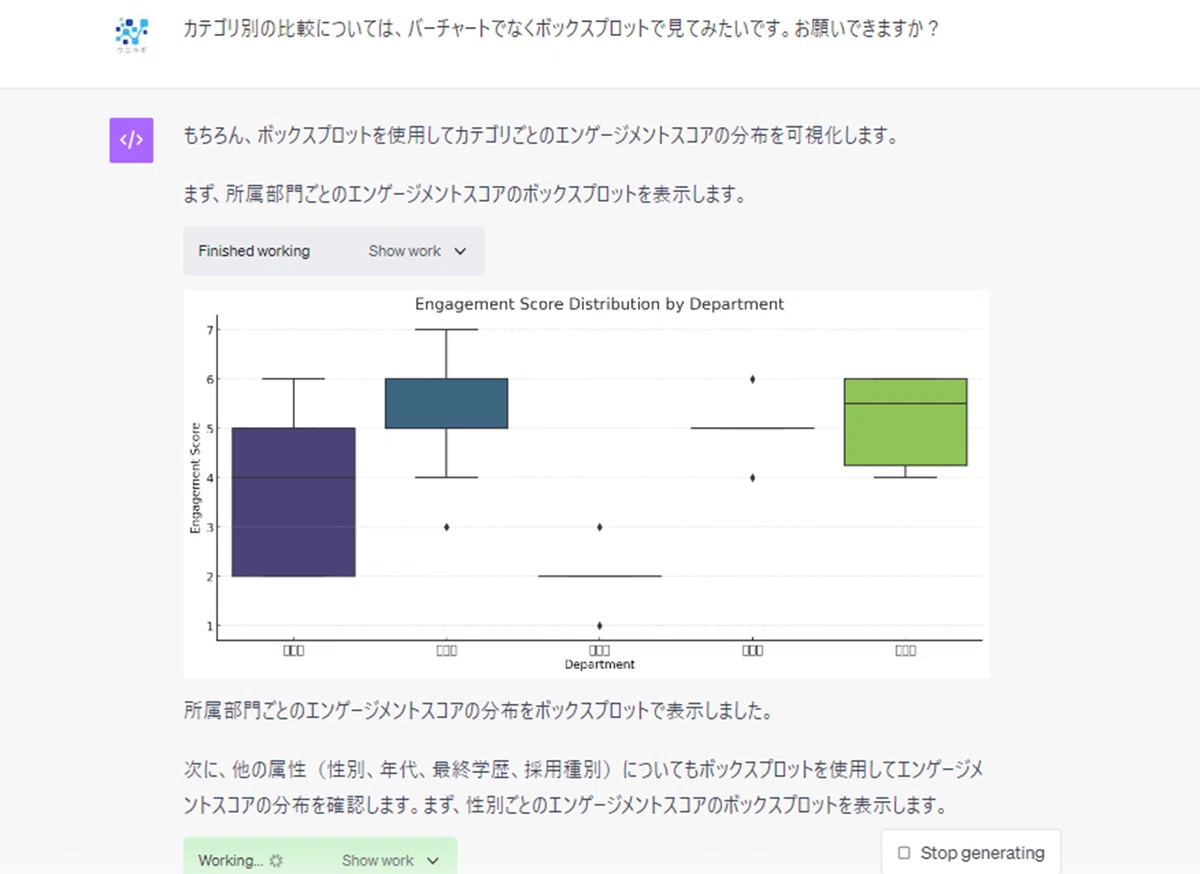
Here, I realized that ChatGPT's graph selection has randomness. This is because I tried the same analysis three times and each was different. When I analyzed it the first time, it used a box plot, and the second time, it analyzed it using only basic statistics without using graphs. Since the prompt was the same, I am curious about what influences this. That said, it is convenient because if you don't like it, you can stop it and request a correction.
Encouraging further analysis
It was going well, but it stopped after just analyzing the categorical variables. When I analyzed it the first time, it dug a little deeper, so I asked it to continue the analysis. When I asked it a bit vaguely, it seems to have taken the approach of analyzing with scatter plots and correlation coefficients.
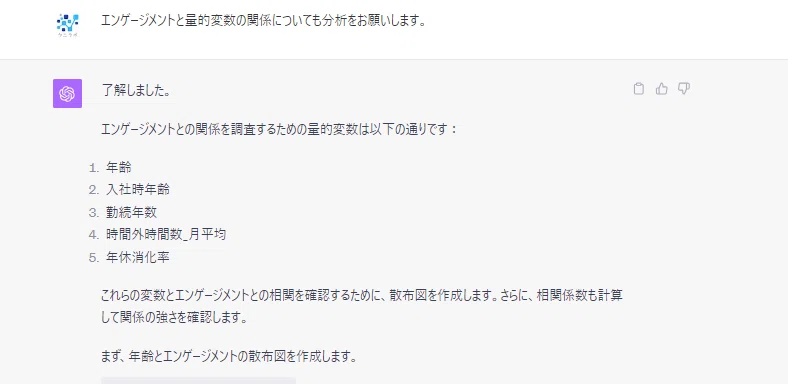
The analysis results for engagement and age are as follows.

The analysis proceeded one after another here as well, and after analyzing the final item, it provided a summary and suggested a regression analysis approach. It might have been in the instructions for the initial analysis approach.

Trying out Regression Analysis
I thought it was convenient that things were moving along so smoothly, but when I think about it, this could also be done with ydata_profiling (formerly pandas_profiling), which handles exploratory data analysis. So, I decided to go a step further and ask for a regression analysis.

Looking at the chat content, I felt like it was creating a predictive model. Checking the code, it seemed like it was going to work hard using scikit-learn.
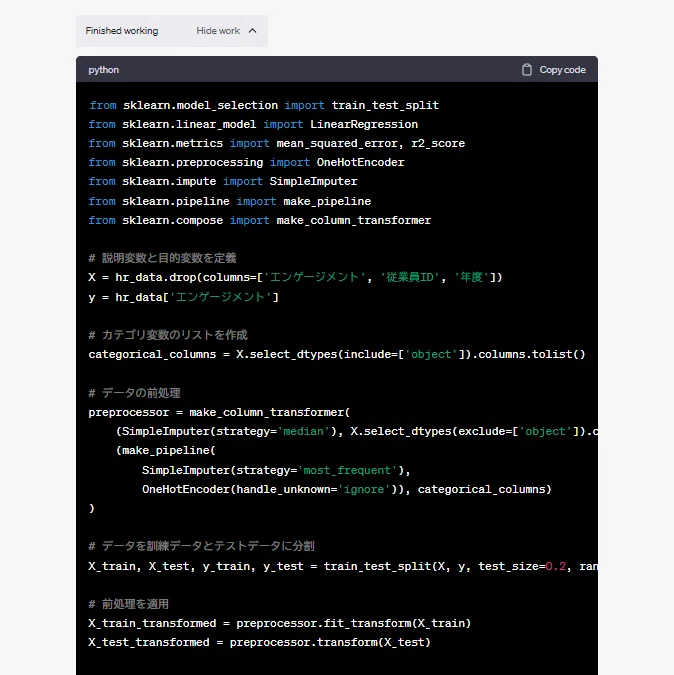
This is fine, but since I wanted to analyze gradually using a simple model assuming a probability distribution rather than a prediction task this time, I asked for a change. When I tried it the first time, it used statsmodels from the beginning, so it seems there is indeed randomness in its behavior.
I prompted it to use statsmodels as a specific library.It's nice that it can figure things out even if there are typos.
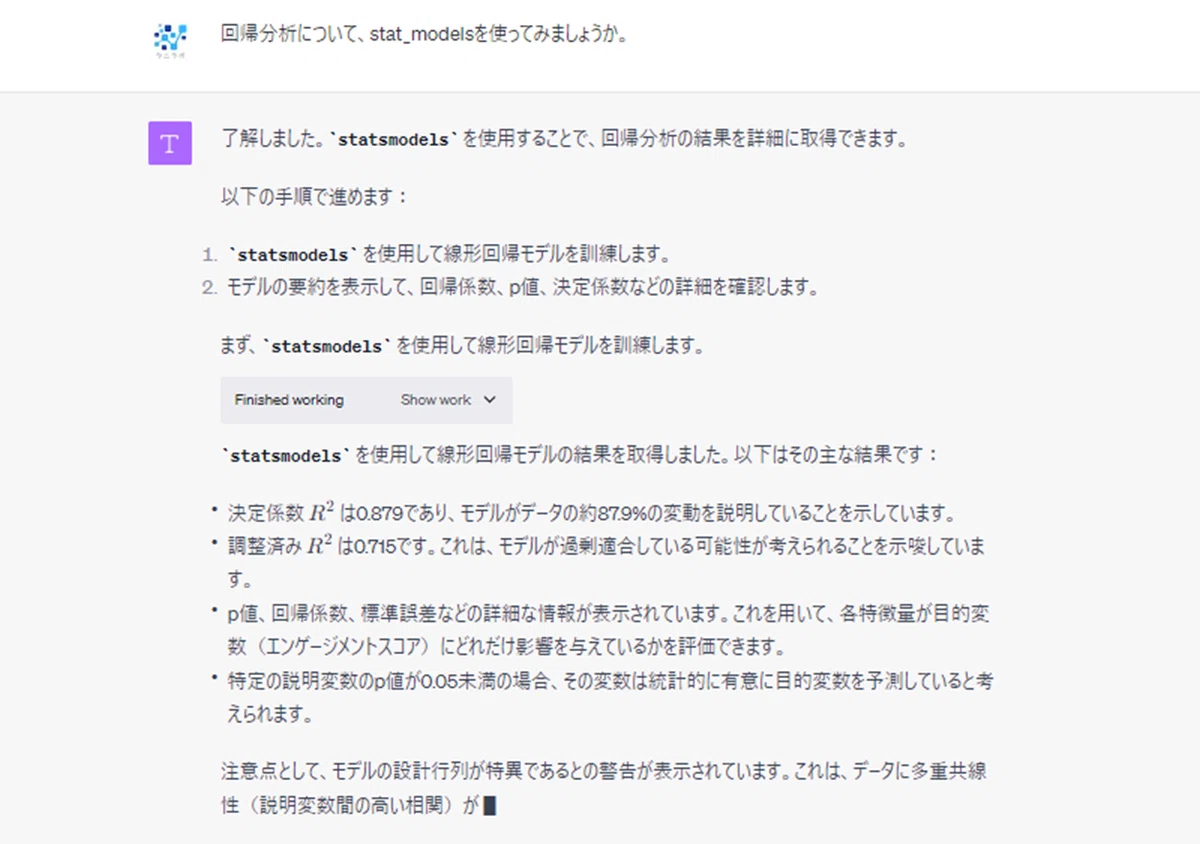
The analysis code and results using statsmodels are as follows. Rather than whether the results were good or bad, I was a bit moved to think that it was working in this way.

Since it explained the output results at length, I asked for a summary and discussion, and it summarized them as follows. Along with model evaluation, it pointed out the problem of multicollinearity.

Thinking Together About Solving the Multicollinearity Problem
Since ChatGPT pointed out the problem of multicollinearity, I decided to think about it together. I came up with three random ideas, and it applied them in order.
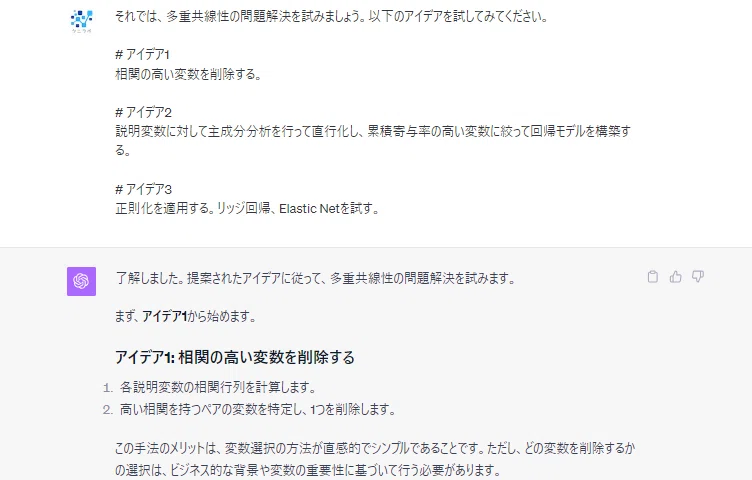
Here, Idea 1, 'deleting variables with high correlation,' can lead to meaningless analysis if not carefully considered in trend analysis like this one. This is because there is a possibility of dropping variables that should be looked at from a business perspective. I was curious about how ChatGPT would handle this point, but I was surprised that ChatGPT took the initiative to mention 'business background and the importance of variables.' Amazing.
However, since I didn't provide the information, it seems to have deleted them randomly. I also smiled at the phrasing 'let's keep it simple this time.' It says that sometimes, doesn't it, like when there's no time.

Next is an example using principal component analysis for Idea 2. Principal component analysis can be effective in resolving multicollinearity, but there is a risk that its interpretation will become difficult in trend analysis. This time, the model itself was not great, so it did not lead to an in-depth analysis.
It is amazing that it processes things somewhat automatically while being fluent in its explanations. However, I was concerned that the cumulative contribution ratio graph was different from when I asked the first time. It seems necessary to look closely at the code to verify this area.

Finally, there is the regularization of Idea 3. When I casually mentioned Ridge regression and Elastic Net, it performed both. As an aside, it's common for work to increase due to reviewer comments like 'you might want to try this,' isn't it?

It was a fresh experience to have it think along with me as described above. However, as I mentioned at the beginning, the data this time is structured in a way that makes it difficult to understand simply by examining the correlations between data columns. Therefore, the analysis results so far have been vague.
Resuming analysis with important hints
At this point, I decided to provide a major hint for the analysis. Specifically, I suggested focusing on the competencies of managers. In fact, this data was crafted so that the competencies of managers in departments or groups would influence the organization's personnel.
In other words, because the data relationships are nested, simply analyzing row by row would not yield results. In addition, I also introduced slight correlations with overtime and age, making it even more complex. It is a bit artificial, but actual HR data should be even more complex.
This time, I provided the information in a top-down manner, but since HR data analysis often focuses on middle management, an experienced analysis team might have thought of it.
With that in mind, I entered the following information into the prompt. I not only provided new information but also gave specific instructions on the analysis approach. However, I did not convey detailed processing steps.
Thank you. As a result of field interviews, I was able to obtain new information. Please resume the analysis with reference to the following information.
# Newly obtained information
According to field interviews, it is suggested that engagement is related to the behavior of managers in each department or group. Simply put, engagement of employees within that organization may change depending on the manager. However, manager behavior has not been digitized.
# Analysis approach
After analyzing manager competencies by group, create feature values at the group level. Then, investigate whether there is a relationship between manager competencies and engagement when viewed at the group level. Please choose an appropriate analysis method.
Aggregation errors and handling
Following the previous instructions, ChatGPT began processing to create manager feature values by group using pandas' groupby. This procedure is similar to the method in the original article. However, errors occurred, and it made corrections several times.
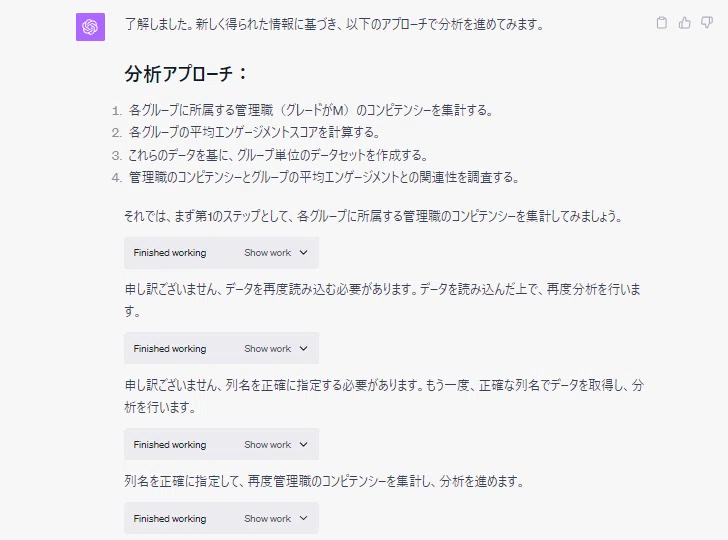
This error was due to a mistake in specifying the groupby items. This mistake was actually something I had made when I explained the data items in the initial prompt. In other words, it was performing the groupby while referring to the content of the data items I explained in the first prompt. I was truly surprised by this. How much does it understand the semantic meaning?
The results of performing the groupby after resolving this issue are as follows.

Regression analysis after reviewing feature values
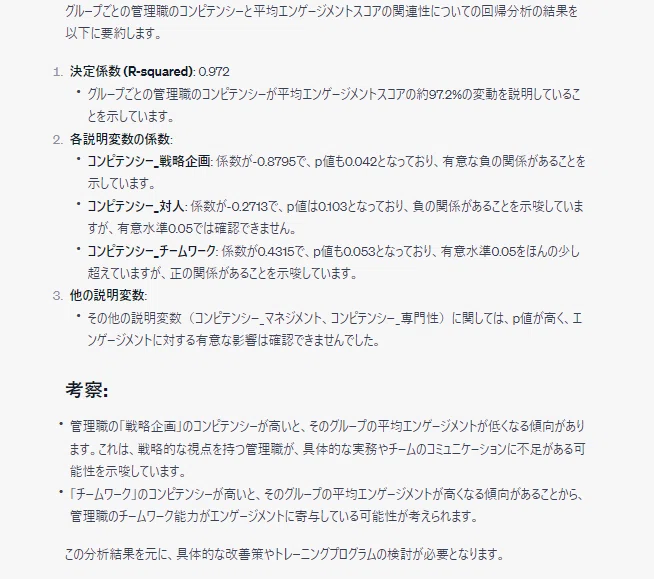
It analyzed the relationship between manager competencies and engagement for each group using a regression model. It seems that sharper insights can be obtained than the previous analysis. What I found a bit interesting is that for items where the p-value exceeded the significance level at 0.053, it made a human-like comment saying, 'It's just slightly over, but...'. For better or worse, that is.
Questions about causality
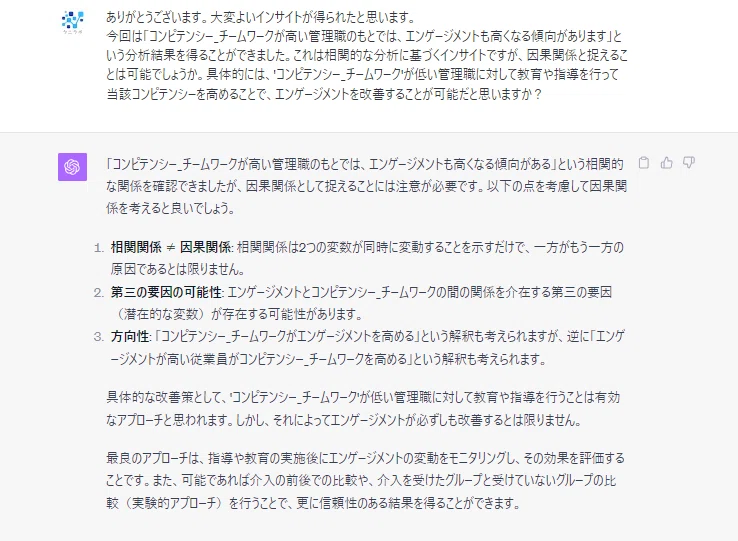
Since ChatGPT provided in-depth action suggestions, I decided to ask an in-depth question as well. I pointed out that while the insights were like correlation analysis, could they be interpreted as causality?I asked this because I wondered if suggesting actions meant it was interpreting them as causal relationships.
Regarding this, ChatGPT honestly admitted that correlation is not causation. Exactly. It advised that I should use the insights obtained this time as a hypothesis and conduct an A/B test. I felt a bit relieved.
This problem always persists in practical work as well. Even if requested by a client, an analyst must not confuse correlation with causation.
Trying analysis with a hierarchical model by setting assumptions
The analysis is mostly complete up to this point. However, I wanted to know how far ChatGPT could go, so I asked it to verify using a hierarchical model. The number of data points is small and it is a bit forced, but I made the following request. It is an idea to see if unobserved individual differences or organizational differences can be controlled.
Thank you. You are absolutely right.
Then, as an attempt, let's try applying a causal model to the observational data.
# Background
From general survey results, it is known that engagement is influenced by various factors, but these can generally be divided into factors related to the "individual" and factors possessed by the "affiliation/group." In other words, there are hidden variables for each individual and affiliation/group, and there is a risk that there are confounding elements in this analysis.
# Analysis Approach
Based on the regression analysis model performed last, I will try to apply the following models. However, since there is a risk of insufficient data, please make adjustments such as creating a hierarchical model.
## Model 1
Apply a model where regression coefficients vary by group. This eliminates the influence of factors held by the group.
## Model 2 Apply a model where regression coefficients vary by employee. This eliminates the influence of factors held by the employee.
## Model 3
Apply a model that combines Model 1 and Model 2 above.
ChatGPT responded flexibly to this as well. Wow, it's amazing. Although I haven't included it, it also pointed out issues like sample size.

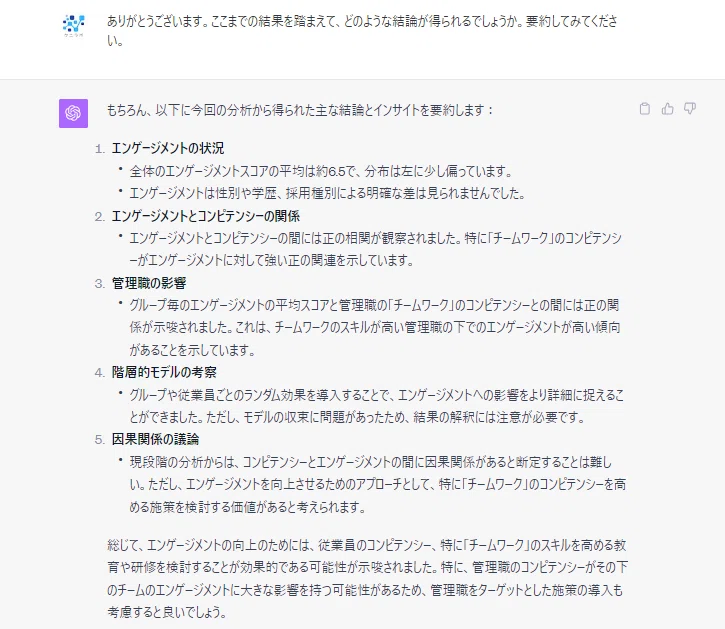
Summary of analysis
Since it was a long communication, I had it summarize the analysis results so far. I have to check the details of the analysis properly, but I was impressed by the report that looked like it was written by a human. The correct answer for this topic was "discovering the relationship between management competencies, teamwork, and engagement," so after many twists and turns, ChatGPT arrived at it.
Bonus: Bayesian estimation
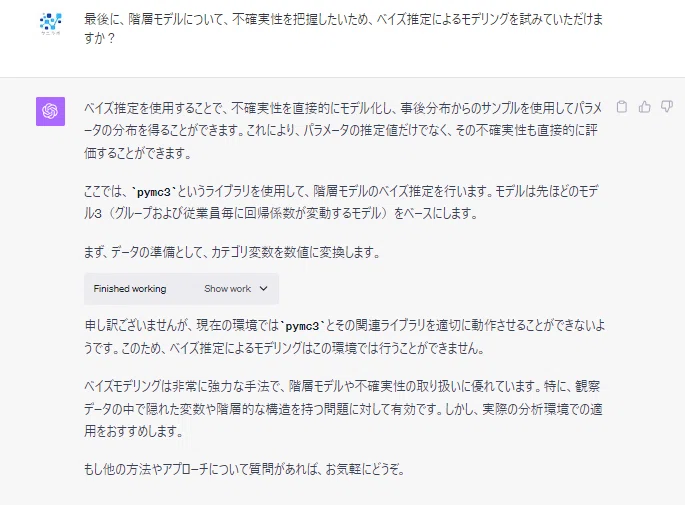
Although I finally arrived at a hierarchical model, there seemed to be a problem with convergence, so I wanted to see the results of Bayesian estimation. I asked ChatGPT to do it, but it seems it couldn't be done due to environmental constraints. By the way, it seemed to try to use pystan instead of pymc3 the first time, so there seems to be randomness in the operation.
Conclusion
This time, I tried analyzing HR data using ChatGPT's Advanced Data Analysis. It was a simulated analysis using my own toy data, but I was truly surprised that it performed an analysis that went deeper than I expected. Dealing with and avoiding errors was also excellent. It is astonishing that AI has progressed this far. It might become a catalyst in people analytics.
On the other hand, I also learned that users need a certain level of analysis experience. This is because it is necessary to give appropriate instructions to ChatGPT and make course corrections based on the results. If it is just about visualizing data columns, there are few problems, but pandas_profiling can do that much. Interactive use seems to be the key, but it can also be said that user skills are required for that. Also, the perspective of data security should always be checked.
By the way, changing the subject, the eye-catching image for this article was created using generative AI. I tried using Canva Pro's Text to Image feature, and it was quite convenient.