
[4 Days from Development to Release] Behind the Scenes of Election Poster Map Development (Technical Edition) #TakahiroAnno

Hello, I am Ueda from the Takahiro Anno office technical team. (Actually, I also handle design and official website production in the production team, and I also propose some policies!)
Last time I introduced how the process of posting posters on 14,000 bulletin boards installed throughout Tokyo evolved. In this article, I would like to explain the development background and technical configuration of the new 'Poster Map' system, which received favorable reviews from social media and volunteers after its release.

When you have significant organizational power, it seems common to assign posting staff to each electoral district to start posting in parallel from the day of the official announcement, or to outsource to specialized companies. However, for us, without organizational support and with financial constraints, the only trump card left was 'digitization' through a poster map. The background leading up to this is explained in detail in the article below.
What is the Election Poster Map?
The Election Poster Map is a digital map that visually overlays the posting status of posters onto the location information of 14,000 election bulletin boards. As shown in the screenshot below, yellow pins are placed on bulletin boards where posters have been posted, and blue pins are placed on bulletin boards where they have not yet been posted, and the feature of this map is that you can instantly understand the posting status.

The pin color changes according to the poster posting status.
You can check the latest status from the link below. As of 7:00 PM on July 3rd, thanks to the tremendous efforts of our volunteers, poster posting has been completed on 95.6% of bulletin boards throughout Tokyo, including the islands.
This approach of embedding information on geographic space is also known as GIS (Geographic Information System), and its use is progressing nationwide in contexts such as urban infrastructure management and disaster prevention.
The function of the poster map is 'placing pins at each bulletin board location and changing the color according to the posting status', which is incredibly simple, but when it comes to a number like 14,000, such simple visualization ended up exerting great power. When we hear 'digitization', we tend to focus on generative AI, which is also used in 'AI Anno' and advanced methods like deep learning, but even just preparing a simple mechanism like this map can greatly improve daily operational efficiency.
Feedback from those who used it
We are very grateful to have received positive feedback not only from volunteers but also from a wide range of people.
ポスター貼り、逆にこういうの無しでこれまでどうやってたんや、、、、、という驚きがある。 https://t.co/Mgr44opPSa
— ハヤカワ五味 (@hayakawagomi) June 27, 2024
素晴らしい。
— 今村裕司 | 𝐌𝐈𝐇𝐎𝐑𝐎代表 (@mihoro_yuji) June 28, 2024
選挙区全域のポスター貼りを網羅できる人は、政党の後押しか、地盤がある人だけになってしまい、才能があっても新たに挑戦する人は知ってもらう機会すら奪われてしまう。
そもそもこの方法自体を変えるべきですが、それをテクノロジーの力で着実に正面突破していくのすごい説得力ある。 https://t.co/sDmPAJUiva
安野さんのポスターマップ、めちゃくちゃ進化しててワロタ
— はいじん (@haijin88) June 29, 2024
これが本物のアジャイル…
これが単にポスター貼りの話じゃないということを想像して欲しい
— 吊人 (@hangedman_XII) June 28, 2024
行政としてこのスピードで都内全域を
可視化できるということを、短い選挙期間中に実装して証明してるのまじぱない
推しです#TOKYOAI https://t.co/q84gHFiXnu
Background of the new poster map development
1. Posting reports exceeding transcription capacity
As introduced in the previous article, initially we used Google My Maps and operated by manually changing (transcribing) the color of the pins placed at each bulletin board location according to the posting status reported via LINE. This is because Google My Maps does not have a public API, and there was no way to mechanically change the pin colors.
A few days after the announcement, happily, many volunteers stepped up, and before we knew it, the amount of posting reports was too large to be transcribed manually, such as several reports per minute. Although the tools used were digital, it placed a heavy burden on the members in charge of transcription, so we felt the need to improve operations.
2. Large-scale correction of location information
As the number of reports increased, it also became clear that the location information of the bulletin boards registered initially was partially incorrect. The reasons include that we were geocoding (converting to latitude and longitude) using the Google Maps API from addresses and could not identify the exact location, and that the data we initially referenced was based on the previous electoral district boundaries and the information was old. Against this background, we were forced to update a large amount of location information, but this also had limits to doing it manually because of the large number.
3. Constraints of the bulk import function
To solve the second issue, we once considered downloading the file (KML file) containing the information for each pin from Google My Maps, updating the location information locally, and re-uploading it. However, when we actually tried it, we faced a new issue where bulk import failed because there were too many pins, and it became clear that it would be wiser to take a completely different approach.
The new 'Poster Map' was developed to solve these issues.
Toward New Map Development
The following states were what we ultimately aimed for with the new map.
Manage data centrally so that if corrections are needed, only one place needs to be changed
Easily change the location information (coordinates) of bulletin boards
Automatically reflect poster placement reports from LINE on the map in near real-time (keeping it running with minimal human intervention)
Comfortable viewing and operation from a smartphone at the poster placement site
Based on the challenges and ideal states mentioned above, we decided to stop using Google My Maps and implement the map ourselves.
Strictly speaking, we did not decide to migrate after waterfall-style planning and detailed team discussions. The reality is that I created a prototype on my own while playing with the data and shared it with relevant members, who said, "This should work," and we ended up migrating as a result. (At Team Anno, not limited to this project, development, policy improvement, and public relations are being advanced in an extremely agile and parallel manner!)
Looking back at the GitHub commit logs, the prototype itself was completed in a few hours, equipped with basic map rendering functions and a process to read data from a spreadsheet.
From there, we shared it with the team, decided on the steps for migration, performed data migration from the old map, and conducted integration tests to reflect data from LINE, successfully releasing it on the night of the 27th, just 4 days after prototype development. I was relieved that we completed the migration without any major issues, as we wanted to make it in time for the weekend when many volunteers would be active.
Behind the Poster Map
The basic structure of the poster map published as a Web app is as shown in the figure below. Note that this system is scheduled to be released as an open-source project after the election period ends.

Database
For the location information (coordinates) of bulletin boards and data on poster placement status, we use Google Spreadsheet as the master database. While more advanced databases exist, we prioritized the ability for non-engineer staff to easily update or rewrite data, and selected Google Spreadsheet, which is familiar to many people.

We use the Web publishing function of Google Apps Script (GAS) to publish the data written in the sheet as a CSV on the Web, download that CSV on our local Linux server, and then process it with a Python script to finally convert it into JSON for the map to read.
In the Python script, the CSV file is read using a library called pandas, and two types of files are output: a JSON file containing each bulletin board coordinate and status, and a JSON file summarizing progress rates by ward/city/town/village and for the entire area. In the distribution JSON file, we manage wards, cities, towns, villages, and placement status by ID to reduce file size, also considering user data usage and rendering speed.
Reporting Tool
As a tool for volunteers to report placement, we use LINE OpenChat. We send reports from LINE to GAS via the LINE API Webhook, and within GAS, we retrieve the bulletin board number (e.g., Setagaya Ward 1-1) to change the status. Since there are variations in the posted text such as "Setagaya 1-1 (no ward)", "Setagaya Ward 1-1 (full-width!)", "Setagaya Ward 01-01 (with 0)", and "Setagaya 1-1, 1-2, 1-3 (multiple reports)", we make full use of text conversion and pattern matching to be able to extract the bulletin board number.
After obtaining the bulletin board number, using that number as a key, we update the posting status of the relevant bulletin board in the Google Spreadsheet to 'Completed' via GAS. Since some people do not use LINE, we receive reports from them via email and manually update the database. Additionally, in cases where the bulletin board number cannot be identified, such as when LINE messages are sent in irregular formats, staff perform the update work manually.
Visualization
For visualization on the map, we use an open-source JavaScript library for maps called Leaflet. This library is characterized by its ability to create interactive maps with minimal code, and it makes it easy to change the base map type or place any type of pin at any location using data prepared by yourself. Unlike Google My Maps, because it can be implemented in-house using JavaScript, we were able to achieve significant customization, such as adding a 'completion rate panel' and a 'legend'.

Since there are a large number of pins (bulletin boards) to render, and performance could potentially slow down depending on the device used, in addition to a map displaying all pins across the entire area, we also prepared maps for each district. Furthermore, considering that writing 14,000 pins directly to the DOM could also be a factor in slowing down performance, we also implemented rendering using Canvas. (Leaflet supports Canvas by default.)
Also, for the progress heat map by ward, city, and town, we used the administrative district polygon data from Linked Open Addresses Japan. Even if there were slight variations in place name notation, the API specification returned the GeoJSON for the targeted district, making it very easy to use.
Hosting
For hosting (delivery), as you can tell from the domain, we use Netlify, and we deploy using netlify-cli from a local server that performs conversion and processing.
The entire sequence of tasks, from downloading CSVs from GAS to converting them into JSON for delivery and deploying, is consolidated into a shell script, which we run periodically every 5 minutes using cron. We considered going serverless using the GitHub Actions Schedule feature, but because of the delay in execution, we decided to complete the processing on our local server this time, as real-time data/freshness is prioritized.
Ingenuity
Enabling the display of only incomplete bulletin boards
In Google My Maps, all pins were always displayed regardless of the posting status, but since volunteers move toward 'bulletin boards that have not been posted yet' when actually posting, in the new map we developed, we made it possible to hide the pins of bulletin boards that have already been posted. We aimed for a design that allows posting work to proceed smoothly in the field without having to deal with unnecessary information.

Also, since this poster map does not support navigation, we made it possible to refer to destinations using apps you are accustomed to using. The coordinates in the callout are links to Google Maps, and clicking them opens the bulletin board location in the app.
Visualizing progress to make it feel like a game
In asking volunteers to post posters on a staggering 14,000 bulletin boards, we tried to incorporate ingenuity to make it as enjoyable as possible for the volunteers. By preparing a heat map for each region, in addition to just changing the color of each bulletin board pin, we made it possible to see at a glance which regions are progressing and which are not.
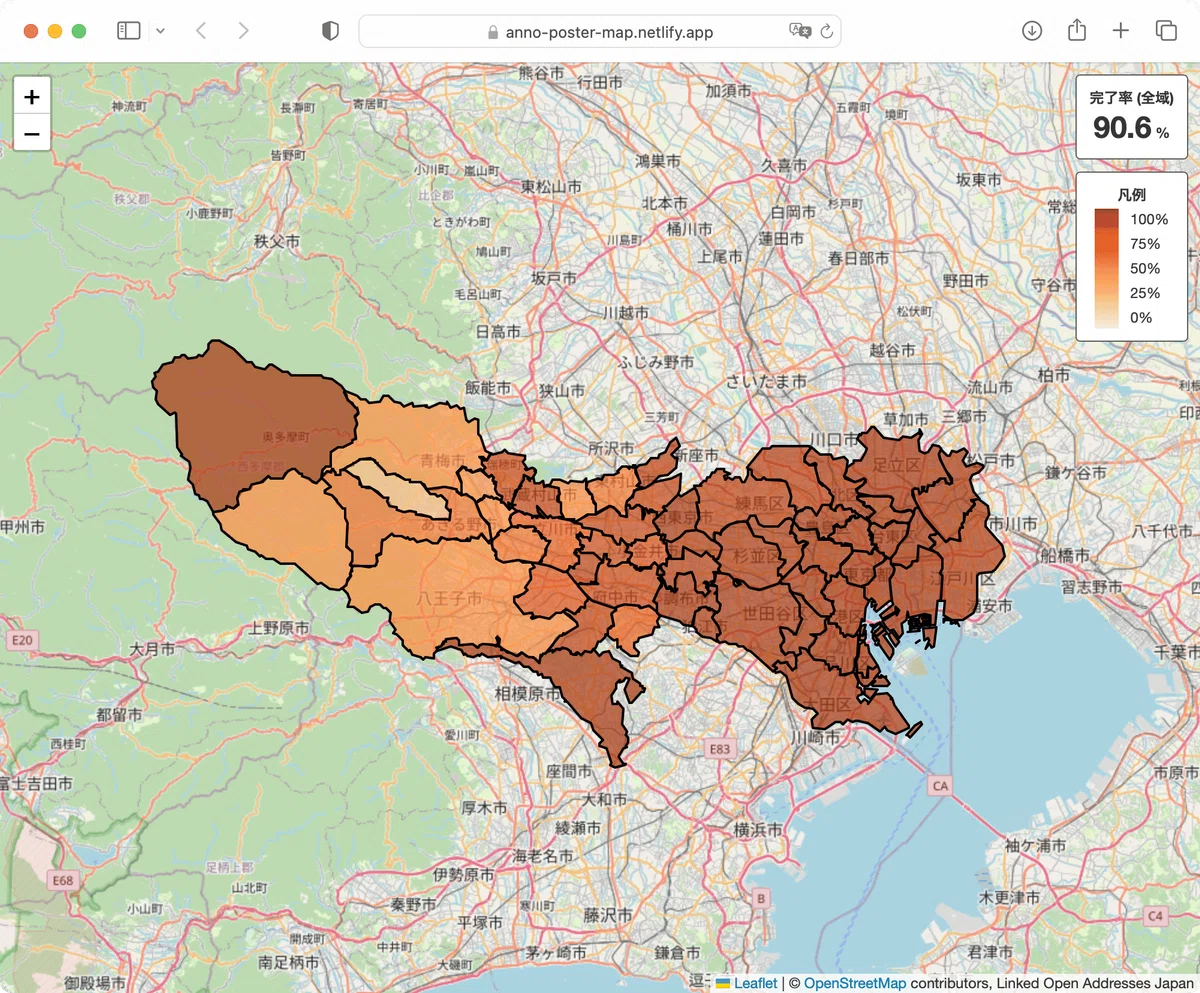
The closer it gets to 100%, the deeper the red color becomes.
Furthermore, we displayed the posting completion rate for the entire Tokyo area as a number next to the map, so that as posting progresses, one can see the number gradually approaching 100%. (Actually, this wasn't implemented at the time of the initial release, but I added it midway through thinking it would be interesting!)
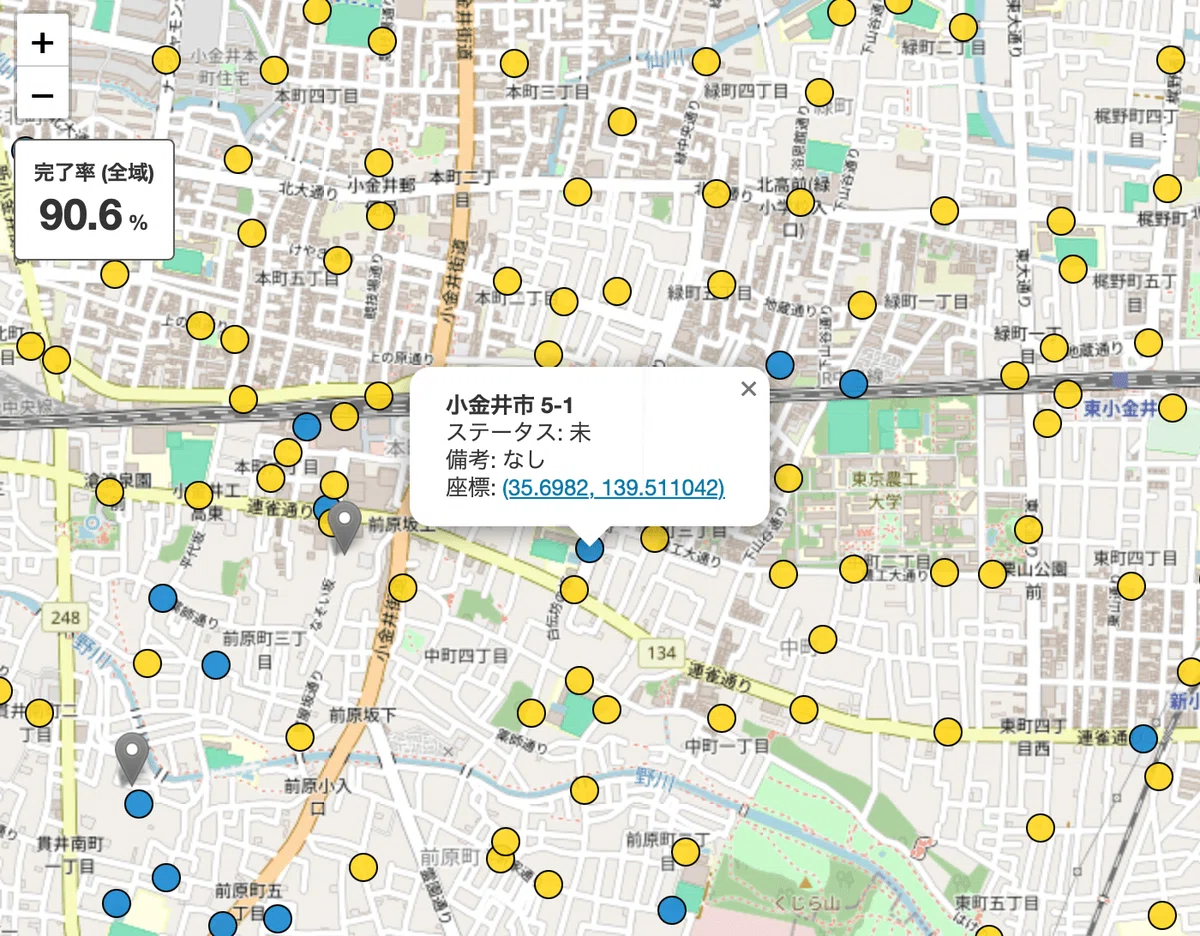
Even though we have never met in person, as we proceed with poster posting together with our 'Team Anno' friends in the LINE open chat, the pins turn yellow, the maps for each ward, city, and town get painted red, and the completion rate numbers go up. Doesn't just this make it feel like a game and get you excited...?
Enabling selection from multiple types of base maps
Tokyo has diverse geographical conditions, ranging from the nature-rich and mountainous Tama region to the islands located up to about 1,000 kilometers from the city center. Since there is no single perfect map that reflects all information for every area in detail, this app allows users to select base maps from three types: Google Maps, OpenStreetMap, and the Geospatial Information Authority of Japan (GSI) maps. I would like to take this opportunity to thank the OpenStreetMap contributors for allowing us to use their maps.
Conclusion
Using digitalization for work only humans can do
As you have seen, even with a simple mechanism, by advancing "digitalization," you can significantly improve daily operational efficiency. If we can effectively leverage the power of technology, we can redirect the effort that was previously lost to manual labor toward essential work that only humans can do, such as going out into the field and listening to the concerns of people right in front of us, which is the kind of essential work only humans can perform.
The importance of data infrastructure
In this project, we focused on "putting up election posters," but a similar approach (GIS) can be directly applied to infrastructure management such as roads and parks, as well as situational awareness during disasters, and I believe it will become an indispensable tool for supporting the lives of Tokyo residents.
This time, the biggest hurdle was digitizing the lists of election bulletin boards, which were provided by each ward and municipality in their own unique formats—literally as a "mountain of paper." However, if such data registries are established, we should be able to accelerate improvements through DX. (If anyone reading this article is from the Digital Agency, or the election administration commission of Tokyo or its wards/municipalities, I would appreciate it if you would consider establishing a base registry that provides location data for election bulletin boards in a unified format!)
Although we did not use any machine learning for the poster map, if we develop the data infrastructure prepared this time and operate it in an integrated manner with additional data, optimizing the placement of posting members, optimizing logistics between poster pickup locations, and building predictive models for poster-posting progress rates are also theoretically possible. Personally, I have reaffirmed that establishing a data infrastructure is the first important step toward advancing DX using advanced machine learning models in various fields.
Updating Tokyo with technology
The poster map is just one example of operational efficiency improvement using technology. Takahiro Anno will use technology to update Tokyo in various areas such as administrative procedures, child-rearing, disaster prevention, infrastructure, and public transportation. For more information on specific policy examples, such as how to leverage technology to advance metropolitan administration, and to learn more about the election campaign, please visit the official website below.
For the latest information, please follow the official X (Twitter) accounts of the candidate and the office!
Takahiro Anno Office (@annotakahiro24)
Takahiro Anno (@takahiroanno)